
Durgesh Tiwari
Author
Modern applications are expected to run 24×7 and serve thousands or even millions of users. Users expect websites and applications to be fast, reliable, and always available.
As applications grow, managing them becomes more challenging. Problems such as server failures, database issues, network outages, software bugs, and sudden traffic spikes can affect the user experience and business operations.
This is where Site Reliability Engineering (SRE) becomes important.
Site Reliability Engineering (SRE) is a practice that combines software engineering with IT operations to build and maintain reliable, scalable, and highly available applications. Instead of depending on manual work, SRE focuses on automation, monitoring, incident response, and continuous improvement to keep production systems healthy.
In simple words, SRE helps keep applications running smoothly by using automation and engineering practices to reduce downtime and improve reliability.
Today, SRE is widely used by companies such as Google, Netflix, Amazon, Microsoft, Meta, Uber, and Airbnb to manage large-scale applications.
Modern applications are made up of many services that work together. If one service becomes slow or fails, it can affect the entire application and impact users.
Without a proper reliability strategy, even a small issue can turn into a major outage.
SRE helps teams:
Detect problems early.
Reduce downtime.
Respond to incidents quickly.
Improve application reliability.
Automate repetitive operational tasks.
Support safe and frequent deployments.
Deliver a better user experience.
Site Reliability Engineering (SRE) is an engineering approach that applies software engineering principles to IT operations.
Instead of handling operational tasks manually, SRE teams build tools and automation to manage deployments, monitoring, alerts, backups, scaling, and recovery processes.
The main goal of SRE is to keep production systems reliable, available, and performant while allowing development teams to release new features safely and frequently.
In simple words, SRE uses automation and engineering practices to keep applications reliable, available, and easy to manage.
An SRE team is responsible for keeping production systems healthy and available. Besides fixing production issues, they also work to prevent future problems through automation and continuous improvement.
Some common responsibilities include:
Monitor production systems.
Configure monitoring and alerts.
Respond to production incidents.
Perform Root Cause Analysis (RCA).
Automate repetitive operational tasks.
Plan infrastructure capacity.
Optimize application performance.
Support disaster recovery planning.
Manage on-call rotations.
Build self-healing systems whenever possible.
Imagine an online shopping website during a festival sale.
Millions of customers visit the website at the same time.
The SRE team continuously monitors the production environment. If traffic suddenly increases, the system automatically adds more servers to handle the load. If a server fails, another server immediately starts serving requests. When a service becomes slow, alerts notify the engineering team so they can investigate before most users are affected.
Because of these practices, the website remains available and customers can continue shopping without interruption.
Site Reliability Engineering (SRE) is based on a few key concepts that help teams measure, monitor, and improve the reliability of production systems. These concepts also help balance system stability with continuous feature development.
The most important SRE concepts are:
Service Level Indicators (SLIs) – Metrics that measure how well a service is performing.
Service Level Objectives (SLOs) – Target values that define the expected performance and reliability of a service.
Service Level Agreements (SLAs) – Formal commitments made to customers about service quality and availability.
Error Budgets – The amount of acceptable failure while still meeting the defined SLO.
Toil Reduction – Reducing repetitive manual work by using automation.
Together, these concepts help SRE teams build reliable, scalable, and highly available applications while supporting safe deployments and continuous improvement.
After an application is deployed, the next step is to check whether it is working as expected. Teams need real data to understand the health, performance, and reliability of the application instead of relying on guesses.
This is where Service Level Indicators (SLIs) come in.
A Service Level Indicator (SLI) is a measurable metric that shows how well a service is performing. It helps engineering teams measure the reliability of a service using real production data.
For example, an SLI can measure availability, response time, error rate, or request success rate.
In simple words, an SLI is a metric that tells you how well your application or service is performing.
Without measuring performance, it is difficult to know whether an application is healthy or if users are facing problems.
SLIs help teams:
Measure application health.
Monitor service reliability.
Detect problems early.
Identify performance bottlenecks.
Make better engineering decisions.
Improve the user experience.
By continuously monitoring SLIs, teams can quickly detect issues and fix them before they affect a large number of users.
Different applications use different Service Level Indicators (SLIs) based on their requirements. These indicators help engineering teams measure the performance, reliability, and health of a service.
Some of the most common SLIs are shown below.
Availability
Latency
Throughput
Error Rate
Success Rate
Durability
Availability measures how often a service is available and accessible to users.
A highly available application stays online most of the time and successfully responds to user requests.
In simple words, Availability tells you how often your application is available for users.
Example
Suppose an API receives:
Total Requests = 1,000,000
Successful Requests = 999,500
Availability is calculated as:
Availability = (999,500 ÷ 1,000,000) × 100 = 99.95%
This means the API was available for 99.95% of all requests.
Latency measures the time an application takes to respond to a user request.
Lower latency means faster responses and a better user experience.
In simple words, Latency tells you how quickly your application responds to a request.
Example
A customer searches for a product on an online shopping website.
The application returns the search results in 180 milliseconds.
The latency for this request is 180 ms.
Throughput measures how many requests an application can process within a specific period.
Higher throughput means the application can handle more users at the same time.
In simple words, Throughput tells you how many requests your application can handle.
Example
An API processes 15,000 requests every second during a festival sale.
The throughput of the API is 15,000 Requests Per Second (RPS).
Error Rate measures the percentage of requests that fail.
A lower error rate usually means the application is healthier and more reliable.
In simple words, Error Rate tells you how many requests failed.
Example
An application receives:
Total Requests = 1,000,000
Failed Requests = 500
Error Rate is calculated as:
Error Rate = (500 ÷ 1,000,000) × 100 = 0.05%
Success Rate measures the percentage of requests that are completed successfully.
A higher success rate means more users receive the expected result.
In simple words, Success Rate tells you how many requests were completed successfully.
Example
If 999,500 out of 1,000,000 requests are successful, then:
Success Rate = 99.95%
Durability measures how safely an application stores data without losing it, even if a failure occurs.
It is especially important for banking, payment, healthcare, and cloud storage systems.
In simple words, Durability tells you how safely your data is stored.
Example
A customer transfers money using an online banking application.
Even if the server crashes immediately after the transaction, the payment record should still be stored safely.
This shows good data durability.
Service Level Indicators help engineering teams understand how well an application is performing.
Some key benefits include:
Measure application performance using real data.
Monitor the health of services.
Detect production issues early.
Identify performance bottlenecks.
Improve application reliability.
Support better engineering decisions.
Improve the user experience.
Measuring an application's performance is important, but it is not enough. Teams also need to decide what level of performance and reliability they want to maintain.
This is where Service Level Objectives (SLOs) come in.
A Service Level Objective (SLO) is a target value that defines the expected performance or reliability of a service. It helps engineering teams set clear goals and measure whether the application is meeting those goals.
In simple words, an SLO is the performance or reliability target that a team wants its application to achieve.
Without clear targets, it is difficult to know whether an application is performing well.
SLOs help teams:
Set clear performance and reliability goals.
Measure service quality.
Prioritize engineering work.
Improve the user experience.
Make better operational decisions.
By monitoring SLOs regularly, teams can identify performance issues before they affect a large number of users.
Different applications define different SLOs based on their business requirements.
Some common SLO examples are:
Metric | Typical SLO |
|---|---|
Availability | 99.9% |
API Success Rate | 99.95% |
Latency | 95% of requests under 200 ms |
Error Rate | Less than 0.1% |
These targets help teams measure whether the application is meeting the expected level of performance and reliability.
Suppose an online payment application defines the following SLOs:
Availability = 99.9%
Response Time = Less than 300 milliseconds
Error Rate = Below 0.1%
The engineering team continuously monitors these targets.
If the application's performance falls below any of these SLOs, the team investigates the issue and takes the necessary steps to improve the service.
Service Level Objectives help engineering teams in many ways.
Define clear performance and reliability targets.
Improve application reliability.
Help prioritize engineering work.
Support better planning and decision-making.
Improve the user experience.
Encourage continuous improvement.
After defining Service Level Indicators (SLIs) and Service Level Objectives (SLOs), the next step is to create a formal agreement with customers. This agreement is called a Service Level Agreement (SLA).
A Service Level Agreement (SLA) is a formal contract between a service provider and its customers. It defines the minimum level of service the provider promises to deliver.
Unlike SLIs and SLOs, which are mainly used by engineering teams, an SLA is a business commitment. If the promised service level is not met, customers may receive compensation, service credits, or other benefits mentioned in the agreement.
In simple words, an SLA is a promise made to customers about the quality and availability of a service.
A Service Level Agreement usually includes:
Guaranteed service availability (uptime).
Performance commitments.
Customer support availability.
Response and resolution times.
Compensation policy if the promised service level is not met.
Suppose a cloud service provider offers the following SLA:
99.95% monthly uptime
24×7 customer support
Critical issues resolved within 4 hours
If the monthly uptime falls below 99.95%, customers receive service credits according to the agreement.
Service Level Agreements provide several benefits:
Build customer trust.
Clearly define service expectations.
Improve accountability.
Protect both customers and service providers.
Encourage high-quality service.
Feature | SLI (Service Level Indicator) | SLO (Service Level Objective) | SLA (Service Level Agreement) |
|---|---|---|---|
What is it? | A metric that measures service performance | A target value for service performance | A formal agreement between the service provider and customers |
Purpose | Measure the current health and reliability of a service | Define the expected level of service | Promise a minimum level of service to customers |
Used By | Engineering teams | Engineering teams | Customers and service providers |
Focus | Current performance | Target performance | Business commitment |
Example | 99.95% Availability | Target: 99.9% Availability | Guaranteed 99.9% Uptime with service credits |
SLIs, SLOs, and SLAs are connected and work together to measure, manage, and guarantee service reliability.
Their relationship follows this sequence:
SLI (Service Level Indicator)
        │
        ▼
Measures the current performance of a service
        │
        ▼
SLO (Service Level Objective)
        │
        ▼
Defines the target level of performance
        │
        ▼
SLA (Service Level Agreement)
        │
        ▼
Promises the target level of service to customersImagine an online banking application.
The SLI measures that the application's availability is 99.95%.
The SLO defines a target of 99.9% availability every month.
The SLA promises customers 99.9% uptime. If the service does not meet this commitment, customers may receive service credits according to the agreement.
This relationship helps engineering teams measure service performance, set reliability goals, and provide clear service commitments to customers.

Building new features is important, but keeping an application reliable is equally important. If teams release changes too quickly, the application may become unstable. If they focus only on stability, development becomes slow.
This is where Error Budgets help.
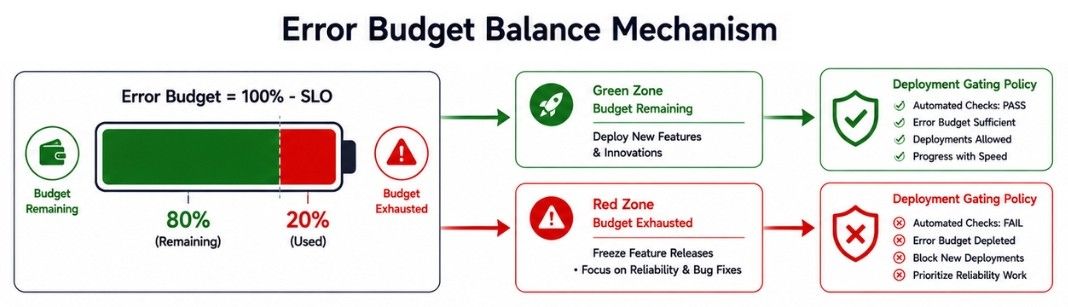
An Error Budget is the amount of failure a service can experience while still meeting its Service Level Objective (SLO).
It helps teams balance system reliability and new feature development without sacrificing either one.
In simple words, an Error Budget tells the team how much failure is acceptable before they should stop releasing new features and focus on improving reliability.
Without an Error Budget, teams may struggle to balance innovation and reliability.
Some teams may release new features too quickly, increasing the risk of production issues. Others may avoid changes completely, slowing down development.
Error Budgets help teams:
Balance feature development and system reliability.
Make better engineering decisions.
Reduce production incidents.
Improve service reliability.
Release new features with more confidence.
An Error Budget is calculated using the application's Service Level Objective (SLO).
Formula
Error Budget = 100% − SLOExample
Suppose an application has an availability SLO of 99.9%.
Then the Error Budget is:
Error Budget = 100% − 99.9% = 0.1%This means the application can have 0.1% downtime during the measurement period and still meet its SLO.
If the application exceeds its Error Budget, the engineering team should focus on improving reliability before releasing more features.
Common actions include:
Pause high-risk deployments.
Investigate recent incidents.
Improve monitoring and alerting.
Fix reliability issues.
Strengthen automated testing.
Improve deployment processes.
Once the system becomes stable again, feature development can continue.
Error Budgets provide several benefits:
Balance innovation and reliability.
Encourage safer deployments.
Improve application reliability.
Reduce unnecessary production risks.
Help teams make data-driven decisions.
Support continuous improvement.
Running a production system often requires engineers to perform the same operational tasks repeatedly. These tasks are necessary to keep the application running, but they do not add long-term value to the system.
This repetitive work is called Toil.
Toil is manual, repetitive, and operational work that can usually be automated.
In simple words, Toil is repetitive manual work that engineers do regularly to keep the system running.
A task is considered Toil if it is:
Manual.
Repetitive.
Time-consuming.
Easy to automate.
Required to keep the system running.
Some common examples of Toil include:
Restarting failed servers manually.
Deploying applications manually.
Running database backups manually.
Copying configuration files.
Checking system logs every day.
Monitoring server health manually.
Restarting services after failures.
Updating infrastructure manually.
As applications grow, these tasks become more frequent and take up valuable engineering time.
Too much Toil reduces engineering productivity because teams spend more time on repetitive tasks instead of improving the system.
It can also lead to:
Reduced productivity.
More human errors.
Slower deployments.
Delayed feature releases.
Higher operational costs.
Reducing Toil allows engineers to spend more time building new features, improving reliability, and solving important engineering problems.
After understanding Toil, the next step is to reduce it.
Toil Reduction is the process of replacing repetitive manual tasks with automation. Instead of asking engineers to perform the same work again and again, automated systems handle those tasks whenever possible.
This saves time, reduces human errors, and allows engineers to focus on improving the application instead of doing repetitive operational work.
In simple words, Toil Reduction means using automation to reduce or eliminate repetitive manual work.
Imagine a server crashes several times every week.
Without Automation
An engineer receives an alert.
Logs into the server.
Restarts the service.
Checks whether the service is running properly.
With Automation
The monitoring system detects the failure.
The service restarts automatically.
A health check verifies that the service has recovered.
An alert is sent only if the automatic recovery fails.
By automating these tasks, engineers save time and can focus on more important work.
Toil Reduction provides several benefits:
Saves engineering time.
Reduces human errors.
Improves productivity.
Speeds up incident recovery.F
Supports faster deployments.
Makes production systems easier to manage.
Allows engineers to focus on building new features and improving system reliability.
SRE teams reduce Toil by automating repetitive operational tasks. Automation saves time, reduces human errors, and allows engineers to focus on improving the system instead of performing manual work.
Some common ways to reduce Toil are:
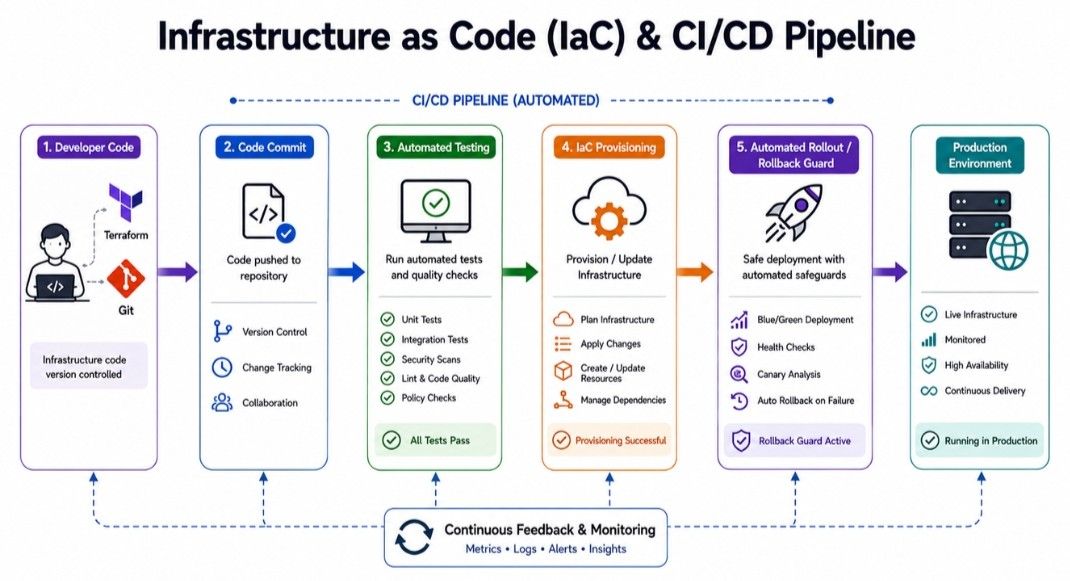
CI/CD pipelines automatically build, test, and deploy applications. This removes the need for manual deployments and makes software releases faster and more reliable.
Infrastructure as Code (IaC) allows teams to manage servers and infrastructure using code instead of configuring everything manually.
Popular tools:
Terraform
AWS CloudFormation
Pulumi
Auto Scaling automatically increases or decreases the number of servers based on application traffic.
Example:
During a festival sale, if website traffic suddenly increases, new servers are added automatically to handle the extra load.
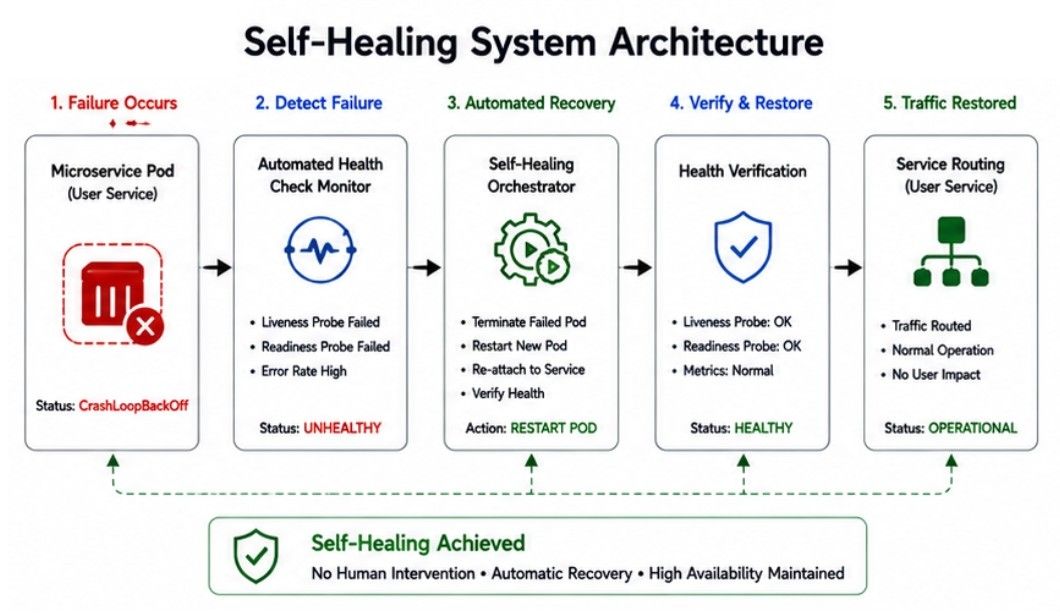
Self-healing systems detect failures and recover without manual intervention.
Examples:
Restart failed services.
Replace unhealthy servers.
Recover crashed containers.
Monitoring tools continuously check the health of the application and send alerts only when an issue is detected.
This reduces the need for manual system monitoring.
Backup systems create regular backups automatically, reducing the risk of data loss and eliminating manual backup tasks.
Configuration management tools ensure that all servers use the same configuration, making infrastructure easier to manage.
Popular tools:
Ansible
Chef
Puppet
If a new deployment causes problems, the system automatically rolls back to the previous stable version.
This helps reduce downtime and restore the application quickly.
Imagine an online banking application with an availability SLO of 99.9%. This gives the engineering team an Error Budget of 0.1% downtime each month.
During one month, several deployment issues cause multiple outages, and the entire Error Budget is used before the month ends.
Instead of releasing new features, the team focuses on improving system reliability. They fix deployment issues, strengthen automated testing, and improve monitoring to prevent similar problems.
While reviewing the incident, the team also finds that engineers spend hours every week manually restarting failed services and checking server health. This repetitive work is Toil.
To reduce this Toil, the team introduces CI/CD pipelines, automated health checks, and self-healing systems that restart failed services automatically.
As a result:
The number of production incidents decreases.
Engineers spend less time on repetitive manual tasks.
New features are released more safely.
The application becomes more reliable for customers.
Site Reliability Engineering (SRE) combines software engineering and IT operations to build reliable, scalable, and highly available applications.
Service Level Indicators (SLIs) measure the performance and reliability of a service using real production data.
Service Level Objectives (SLOs) define the target level of performance that a service should achieve.
Service Level Agreements (SLAs) are formal commitments that specify the level of service promised to customers.
Error Budgets help teams balance system reliability and new feature development by defining the acceptable amount of failure.
Toil is repetitive manual operational work that adds little long-term value and can usually be automated.
Toil Reduction uses automation to eliminate repetitive tasks, reduce manual effort, and improve engineering productivity.
SRE practices such as CI/CD Pipelines, Infrastructure as Code (IaC), Auto Scaling, Self-Healing Systems, Automated Monitoring, and Automated Rollbacks help reduce downtime, improve reliability, and deliver a better user experience.
