
Durgesh Tiwari
Author
A production system may have hundreds or thousands of servers producing telemetry every second:
Application and error logs
Request and database logs
CPU, memory, and network metrics
Latency and business metrics
Distributed traces
When something goes wrong, engineers need to answer questions such as:
Which service failed?
When did the problem start?
How many users are affected?
Did error rates increase?
Did latency suddenly spike?
Which request caused the failure?
Without centralized logging and monitoring, debugging a distributed system becomes extremely difficult.
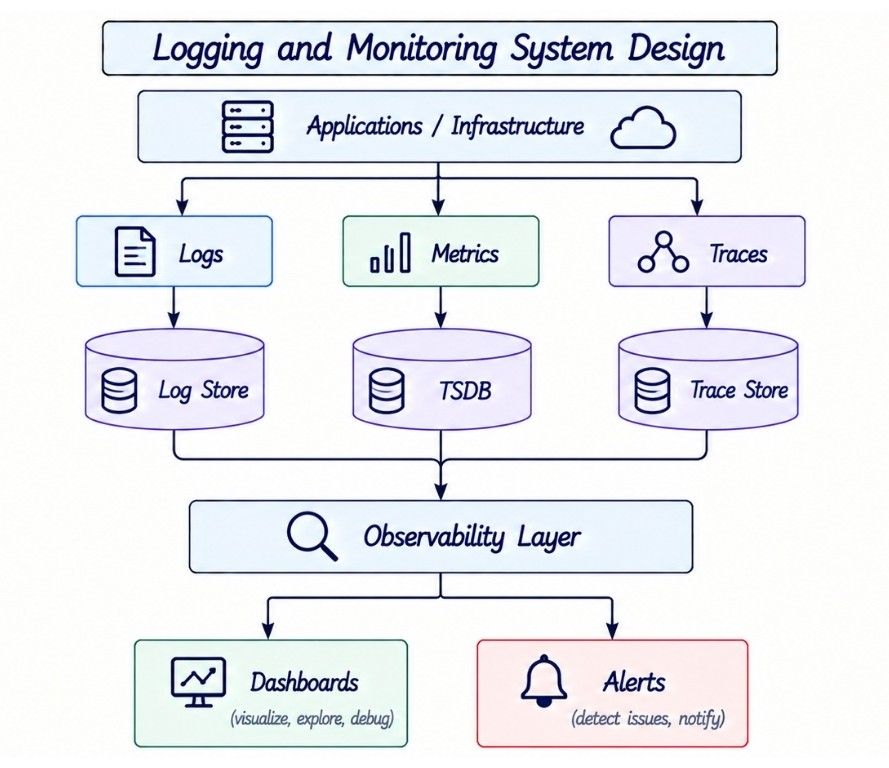
In this guide, we will design a scalable Logging and Monitoring System covering log collection, aggregation, storage, indexing, metrics, dashboards, alerting, distributed tracing, retention, scalability, multi-tenancy, backpressure, and failure handling.
Logging and monitoring are closely related, but they solve different problems.
Logging records individual events generated by applications and infrastructure.
2026-09-12T10:30:21Z
service=payment-service
level=ERROR
request_id=req_123
message="Payment provider timeout"
A log tells us:
Something happened.
Logs provide detailed context that engineers can search during debugging.
Monitoring measures the health and behavior of a system over time.
CPU Usage = 82%
Request Rate = 20,000 requests/sec
Error Rate = 4.7%
P99 Latency = 850 ms
Monitoring helps answer:
How is the system behaving?
It is usually based on metrics collected and aggregated over time.
Aspect | Logging | Monitoring |
|---|---|---|
Focus | Individual events | Overall system behavior |
Data | Detailed records | Aggregated metrics |
Example | Database connection failed | 215 DB errors/minute |
Primary Use | Debugging and investigation | Detection and health tracking |
Typical Query | Find logs for | Error rate over last 10 minutes |
For example:
Log:
"Database connection failed for request req_123"

Metric:
database_connection_errors = 215/minute
The metric tells us that something is wrong.
The log helps us investigate why.
A mature observability platform usually combines logs, metrics, and traces.
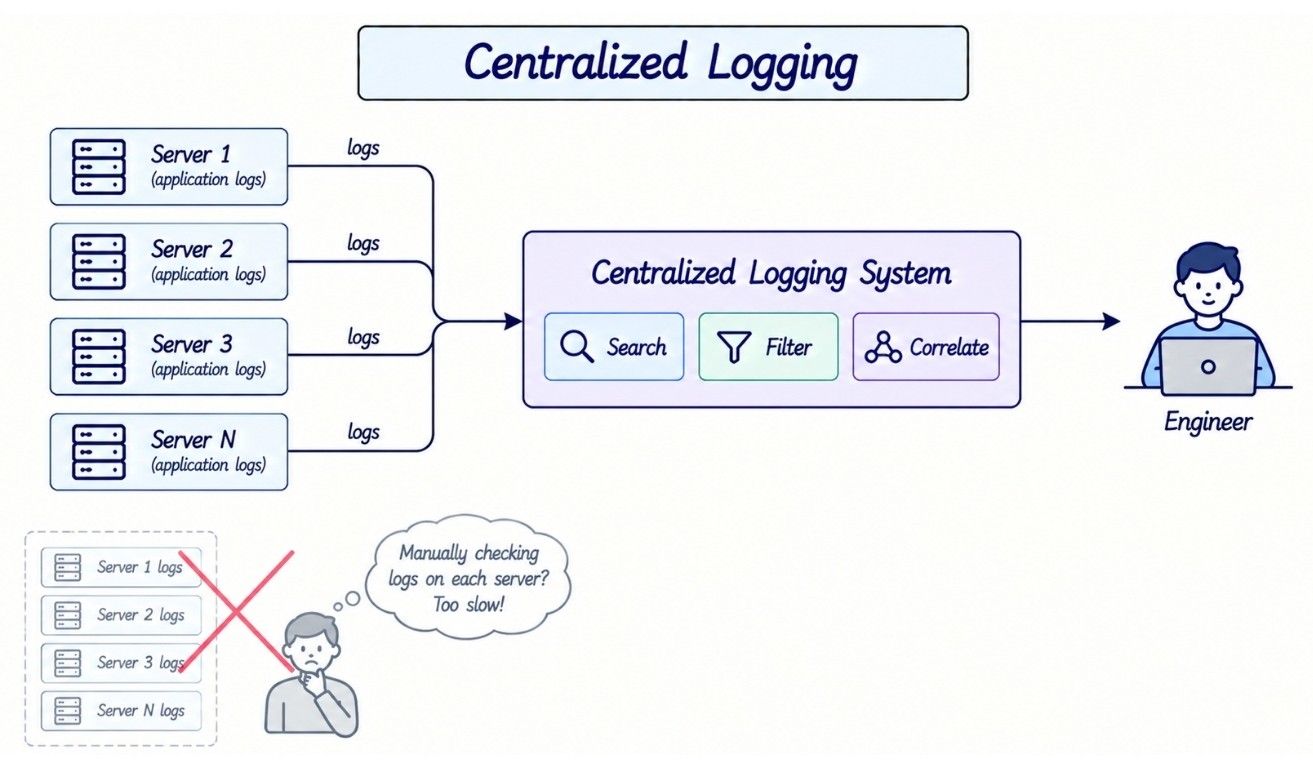
In a distributed system, logs are generated across many servers, containers, and services. Manually checking each machine becomes impractical as the system grows.
For a small system:
Server 1
Server 2
Server 3
manual log inspection may still work. But it does not scale to:
10,000 application instances
500 microservices
Multiple regions
Dynamic containers and instances
A centralized logging system collects logs from different sources into one platform:
Server 1 ----+
             |
Server 2 ----+----> Centralized Logging System
             |
Server 3 ----+
This allows engineers to search, filter, and correlate logs across services from one place, making debugging and incident investigation much easier.
A large-scale logging and monitoring system must ingest, store, and query huge volumes of telemetry while keeping recent data available for debugging and alerting.
At scale, the platform may handle:
Millions of log events/second
Billions of metric samples/day
Terabytes of telemetry/hour
Thousands of concurrent queries
Millions of active metric series
The main challenges are:
High Throughput: Continuously ingest large volumes of logs and metrics.
Durability: Avoid losing important telemetry during failures.
Near Real-Time Visibility: Make recent data available quickly.
Scalable Storage and Queries: Store large datasets while supporting fast searches.
Cost Control: Manage indexing, retention, compression, and storage costs.
Multi-Tenancy and Isolation: Prevent one tenant or workload from affecting others.
Failure Handling: Keep ingestion working even when downstream components are slow or unavailable.
Unlike a normal CRUD application, an observability platform is dominated by high-volume writes, time-based data, large-scale aggregation, and search workloads.
The system should support:
Log Collection: Collect application and infrastructure logs.
Metric Collection: Collect system and application metrics.
Search and Query: Search logs and aggregate metrics over time.
Dashboards and Alerts: Visualize system health and notify engineers about important failures.
Retention: Store telemetry according to retention policies.
Correlation: Connect logs and traces belonging to the same request.
For example:
Log Search:
service = payment-service AND level = ERROR

Metric Query:
P99 latency grouped by service

Alert:
error_rate > 5% for 5 minutes
Advanced systems may also support distributed tracing, audit logging, SLO monitoring, and anomaly detection.
The key requirements are:
High Throughput: Handle millions of telemetry events per second.
Durability and Availability: Minimize telemetry loss and continue ingestion during failures.
Near Real-Time Visibility: Make recent telemetry available quickly.
Horizontal Scalability: Scale ingestion, storage, and query layers independently.
Cost Efficiency: Control cost using compression, retention, sampling, and tiered storage.
Tenant Isolation: Protect tenants from unauthorized access and noisy neighbors.
Graceful Degradation: Keep critical ingestion working even if search or downstream processing is temporarily degraded.
During an incident, preserving incoming telemetry can be more important than making it immediately searchable.
Assume:
Servers                = 100,000
Logs per server        = 100 events/sec
Average event size     = 500 bytes
Total log ingestion:
100,000 × 100
= 10 million events/sec

10 million × 500 bytes
≈ 5 GB/sec

5 GB/sec × 86,400
≈ 432 TB/day
This is raw data before replication, indexing, and other storage overhead.
The scale directly affects our design:
10M events/sec
→ Horizontal collectors + partitioned ingestion

432 TB/day
→ Compression + retention + tiered storage

Large search volume
→ Partitioned storage + distributed queries

Millions of metric series
→ Cardinality controls
At this scale, we need a distributed ingestion, storage, and query architecture rather than storing all telemetry as ordinary database rows.
Before designing the architecture, define the main entities handled by the system.
Entity | Purpose |
|---|---|
LogEvent | One application or infrastructure event |
MetricSample | Numeric measurement at a point in time |
Trace | Complete path of a distributed request |
Span | One operation within a trace |
AlertRule | Condition used to detect a problem |
Tenant | Customer or organization that owns telemetry |
A log event might look like:
{
  "timestamp": "2026-09-12T10:30:21Z",
  "tenant_id": "tenant_42",
  "service": "payment-service",
  "level": "ERROR",
  "request_id": "req_123",
  "trace_id": "trace_abc",
  "message": "Provider timeout"
}
Logs, metrics, and traces have different access patterns, so they do not necessarily use the same storage system.
At the design level, the platform may expose interfaces such as:
POST /v1/logs
POST /v1/metrics
POST /v1/traces

GET /v1/logs/search
GET /v1/metrics/query

POST /v1/alert-rules
In practice, agents and collectors usually send telemetry in batches or streams rather than making one HTTP request for every event.
The important architectural separation is:
Telemetry Ingestion
        ↓
Storage / Processing

Telemetry Querying
        ↓
Search / Analysis
Ingestion is write-heavy and continuous, while querying is read-heavy and often unpredictable. Keeping them logically separate allows both paths to scale independently.
A scalable observability platform usually handles three main telemetry signals:
Logs for detailed events and debugging
Metrics for system health and trends
Traces for following requests across distributed services
A simplified high-level architecture is:
                  Applications / Infrastructure
                            |
           +----------------+----------------+
           |                |                |
           v                v                v
       Log Agents     Metric Exporters    Trace SDKs
           |                |                |
           v                v                v
    Log Collectors   Metric Collectors Trace Collectors
           |                |                |
           v                v                v
    Durable Broker         TSDB          Trace Store
           |
           v
    Log Processors
           |
           v
   Searchable Log Store

                Query / Observability Layer

    Log Store          TSDB          Trace Store
        \                |               /
         +---------------+--------------+
                         |
                         v
                    Query Layer
                         |
               +---------+---------+
               |                   |
               v                   v
           Dashboards          Investigation

                     Alerting

                       TSDB
                        |
                        v
                Alert Evaluator
                        |
                        v
                 Alert Manager
                        |
                        v
                 On-Call Engineer
The three pipelines may share some infrastructure, but their storage and query patterns are different.
This separation also allows logs, metrics, and traces to scale independently. For example, a temporary slowdown in log indexing should not prevent metric-based alerts from detecting a production incident.
Logs can come from:
Application servers
Containers
Databases
Load balancers
API gateways
Operating systems
Message brokers
Kubernetes workloads
Security systems
Unstructured log:
Payment failed for user 123Structured log:
{
  "event": "payment_failed",
  "user_id": "123",
  "error_code": "PROVIDER_TIMEOUT",
  "provider": "provider_a"
}
Structured logging allows queries such as:
provider = provider_a
AND error_code = PROVIDER_TIMEOUT
Structured logs are generally easier to search, filter, aggregate, and process.
Common levels include:
TRACE
DEBUG
INFO
WARN
ERROR
FATAL
For example:
INFO  → user successfully logged in
WARN  → downstream request is unusually slow
ERROR → database query failed
Very verbose production logging should be controlled because unnecessary logs increase cost and noise.
Instead of making every application communicate directly with the centralized logging backend, run an agent close to the application.
Application
     ↓
Local File / stdout
     ↓
Log Agent
     ↓
Collector
The agent can:
Read files or container output
Buffer events
Batch events
Compress data
Add metadata
Retry failed uploads
If the backend is temporarily unavailable:
Application
     ↓
Agent Buffer
     ↓
Backend Unavailable
     ↓
Wait / Retry
This prevents temporary observability failures from immediately affecting the application.
Bad design:
User Request
     ↓
Application
     ↓
Wait for Remote Logging Service
     ↓
Continue Request
If the logging service becomes slow, the product itself becomes slow.
Prefer:
Application
     ↓
Local / Asynchronous Logging
     ↓
Continue Request
Ordinary telemetry should normally remain outside the critical business request path.
Audit logging can require stronger durability guarantees and should be treated separately.
Agents send telemetry to horizontally scalable collectors.
Agent 1 ----+
            |
Agent 2 ----+----> Collector Cluster
            |
Agent 3 ----+
Collectors may perform:
Authentication
Validation
Batching
Rate limiting
Metadata enrichment
Compression
Routing
Collectors should remain relatively stateless so they can scale horizontally.
Suppose collectors receive:
10 million events/secbut storage temporarily processes only:
7 million events/secDirect collector-to-storage writes can propagate storage pressure through the ingestion pipeline.
Instead:
Collectors
    ↓
Durable Message Broker
    ↓
Log Processors / Storage Consumers
The broker absorbs temporary differences between:
Incoming Rate
     >
Processing Rate
This gives us:
Buffering
Failure isolation
Independent scaling
Replay where supported
Decoupling between ingestion and indexing
A broker is useful for temporary bursts.
It is not infinite storage.
At high throughput, one broker partition is not enough.
Events may be partitioned using:
tenant_id
service
region
source_id
For example:
hash(tenant_id + service) % NHowever, imagine:
Tenant A → 50× normal trafficPutting all of Tenant A into one partition can create a hotspot.
A scalable design may combine:
Tenant
  +
Time / Service
  +
Hash Shard
with:
Per-tenant quotas
Multiple partitions for large tenants
Rate limiting
Workload isolation
The goal is to prevent one noisy tenant from degrading the entire platform.
After ingestion:
Raw Logs
   ↓
Parse
   ↓
Enrich
   ↓
Redact
   ↓
Transform
   ↓
Index / Store
Processors may:
Parse timestamps
Extract fields
Normalize severity
Add service metadata
Redact sensitive information
Generate derived fields
Route logs to different storage tiers
Logs should avoid storing:
Passwords
Access tokens
API keys
Card data
Session cookies
Sensitive personal information
For example:
Authorization: Bearer abc123...should never become a normal searchable log value.
The best defense is:
Do not log the secretIf redaction is still required, perform it as early as practical:
Application
    ↓
Agent
    ↓
Collector
Earlier redaction reduces the chance that sensitive information reaches durable storage.
Log storage needs:
Very high write throughput
Time-range queries
Text and field search
Compression
Efficient retention
Large sequential ingestion
A logical record may contain:
timestamp
tenant_id
service
host
level
message
trace_id
request_id
additional_fields
Logs are normally append-heavy and rarely updated.
A log represents something that already happened, so immutable or append-oriented storage fits naturally.
If hundreds of terabytes of logs exist, scanning everything for:
request_id = req_123would be too expensive.
Frequently queried fields may therefore be indexed:
timestamp
service
level
trace_id
request_id
host
region
But indexing everything increases:
Storage usage
CPU usage
Memory usage
Write amplification
Indexing latency
A common strategy is:
Frequently queried fields
→ Indexed

Less common fields / raw payload
→ Compressed storage
The key question is:
Which fields are worth indexing?
There is no universal answer.
Recent logs are searched much more frequently than old logs.
Use tiered storage:
Hot Storage
→ Recent
→ Fast
→ Heavily indexed

Warm Storage
→ Older
→ Lower cost

Cold Storage
→ Archive
→ Object storage
Example:
0–7 days  → Hot
8–30 days → Warm
30+ days  → Cold
This reduces long-term storage cost while keeping recent incident data fast.
Different telemetry can have different retention requirements.
DEBUG logs       → 3 days
Application logs → 30 days
Security logs    → 1 year
Audit logs       → Policy dependent
Retention can vary by:
Tenant
Environment
Log type
Compliance requirement
Time-based partitioning makes old data easier to expire efficiently.
At this point, the logging path is:
Applications / Hosts
        ↓
    Log Agents
        ↓
    Collectors
        ↓
 Durable Broker
        ↓
    Processors
        |
   +----+----+
   |         |
   v         v
Hot Store  Cold Archive
   |
   v
Query Service
   |
   v
Engineer / Dashboard
This is the core centralized logging pipeline.
Logging records individual events, while monitoring primarily uses metrics to understand system behavior over time.
Examples:
http_requests_total = 1,320,000
cpu_usage = 72.4%
request_latency_ms = 85
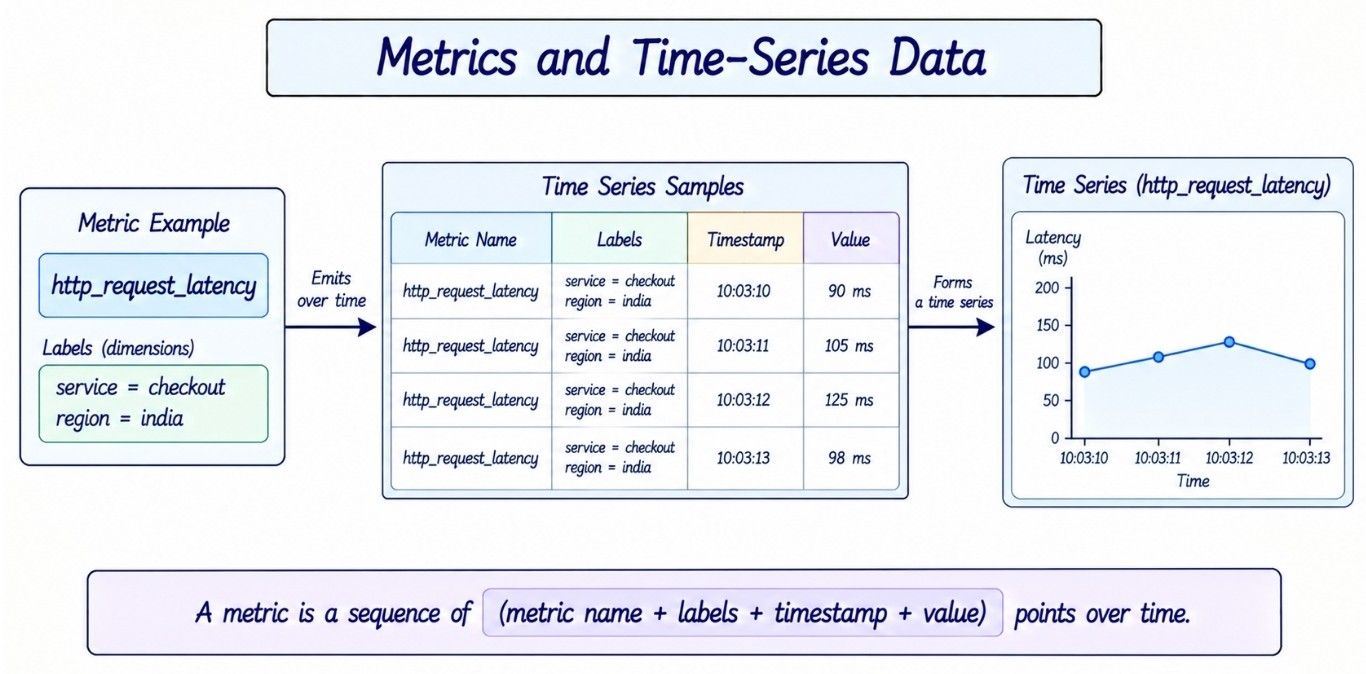
A metric time series is conceptually identified by:
Metric Name + Labels + Timestamp + Value
For example:
metric:    http_request_latency
service:   checkout
region:    india
timestamp: 10:03:12
value:     125 ms
Labels allow the same metric to be analyzed across dimensions such as service, region, endpoint, or status code. However, too many unique label combinations can create high cardinality, which we will discuss later.
Monitoring systems commonly use four metric types.
A cumulative value that increases over time and may reset when the process restarts.
requests_total
errors_total
Counters are useful for calculating rates such as requests per second or errors per minute.
A value that can increase or decrease.
cpu_usage
memory_usage
active_connections
Gauges are useful for values that represent the current state of a system.
A histogram groups observations into buckets to represent their distribution.
request_latency
response_size
Histograms are especially useful for analyzing latency distributions and estimating percentiles such as P95 and P99.
A summary represents statistical information about observed values and, depending on the monitoring system, may expose values such as count, sum, and precomputed quantiles.
Summaries can be useful for latency statistics, but precomputed quantiles are generally harder to aggregate across multiple instances than histogram data.
Metrics are commonly collected using push or pull models.
Aspect | Push | Pull |
|---|---|---|
Flow | Source sends metrics | Collector scrapes source |
Control | Source controls sending | Monitoring system controls collection |
Short-Lived Jobs | Convenient | More difficult |
Target Health | Harder to infer from silence | Failed scrape can indicate a problem |
Discovery | Less central | Usually requires service discovery |
Push:
Application
    ↓
Monitoring Backend
Pull:
Metric Collector
      ↓
Application /metrics
Neither model is universally better.
Many real systems use a combination.
In dynamic infrastructure, instances constantly appear and disappear.
The metric collector needs to discover active targets.
Service discovery may provide:
service
instance
address
region
environment
This is especially important with containers, orchestration platforms, and autoscaling.
Metrics are commonly stored in a Time-Series Database (TSDB).
Typical query:
Find metric X
between time A and time B
filtered by labels
Example:
service = payment-service
metric = error_rate
last 24 hours
The workload is optimized around:
Metric
+
Labels
+
Time Range
rather than arbitrary relational queries.
Suppose:
http_requests_totalhas labels:
service=payment
region=us-east
status=500
Labels make filtering and aggregation powerful.
But every unique label combination can create a separate time series.
Suppose we have:
10 services
20 regions
10 status codes
100 endpoints
Potential combinations:
10 × 20 × 10 × 100
= 200,000 series
Now add:
user_idwith one million unique users.
The number of possible series becomes impractical.
Avoid unbounded metric labels such as:
user_id
request_id
random UUID
These identifiers usually belong in logs or traces, not normal metrics.
Cardinality control is one of the most important production concerns in monitoring systems.
Metric data naturally partitions by time.
2026-09-10
2026-09-11
2026-09-12
Time partitioning helps with:
Range queries
Retention
Compression
Old-data deletion
Keeping every high-resolution sample forever can still be expensive.
Older data may therefore be downsampled:
10-second samples
      ↓ after 7 days
1-minute aggregates
      ↓ after 30 days
1-hour aggregates
However, downsampling can hide spikes.
Suppose:
10:00:00 → 20%
10:00:10 → 20%
10:00:20 → 100%
10:00:30 → 20%
Instead of preserving only an average, an aggregate may retain:
min
max
average
count
Downsampling reduces cost but loses some detail.
Dashboards visualize system health.
Typical panels include:
Request rate
Error rate
P50/P95/P99 latency
CPU and memory
Queue depth
Database connections
Flow:
Dashboard
    ↓
Query API
    ↓
Metric Store
Repeated dashboard queries may be cached.
Suppose average latency is:
100 msbut:
95% requests = 50 ms
5% requests  = 1,050 ms
The average hides poor tail behavior.
Useful percentiles include:
P50
P90
P95
P99
P99 means approximately 99% of measured requests completed at or below that latency.
A useful monitoring framework is:
Latency
Traffic
Errors
Saturation
Latency: How long requests take.
Traffic: How much demand the system receives.
Errors: How frequently requests fail.
Saturation: How close resources are to their limits.
Saturation may include:
CPU
Memory
Connections
Queue Depth
Disk Usage
These signals provide a practical overview of service health.
Dashboards require humans to look at them.
Alerts automatically notify engineers when important conditions occur.
Metrics
   ↓
Alert Rule Evaluator
   ↓
Alert State
   ↓
Alert Manager
   |
   +──→ Email
   +──→ Chat
   +──→ SMS
└──→ PagerA basic rule:
error_rate > 5%may fire because of a temporary spike.
A better rule can require persistence:
error_rate > 5%
FOR 5 minutesOK
↓
PENDING
↓
FIRING
↓
RESOLVEDIf 500 application instances fail because of one database outage, engineers should not receive 500 independent pages.
Related alerts can be grouped by:
service
region
alert_typeDatabase Alert → Database Team
Payment Alert → Payments Team
Security Alert → Security TeamOne root cause may create many symptoms.
Database Down
     |
     +──→ Payment Errors
     +──→ Checkout Errors
     +──→ High Latency
Alert systems may support:
Grouping
Inhibition
Silencing
Maintenance windows
The goal is not to create more alerts.
The goal is to create actionable alerts.

A measured reliability value.
Successful Requests / Total RequestsA target for an SLI.
99.9% availabilityA contractual reliability commitment that may have business consequences.
If the SLO is:
99.9%the allowed failure percentage is approximately:
0.1%This allowance is the error budget.
It helps teams balance reliability against development velocity.
Metrics tell us aggregate behavior.
Logs provide detailed events.
Distributed tracing follows a single request across multiple services.
API Gateway
    ↓
Order Service
    ↓
Payment Service
    ↓
Fraud Service
    ↓
Database
If the request takes three seconds, tracing helps identify which operation consumed the time.
A distributed request has a:
trace_idIndividual operations create spans.
Trace: abc123

API Gateway        50 ms
Order Service     100 ms
Payment Service  2400 ms
Database           20 ms
The bottleneck is immediately visible.
The trace context must propagate downstream:
Service A
trace_id=abc123
    ↓
Service B
trace_id=abc123
    ↓
Service C
trace_id=abc123
Logs can also include the same trace ID.
This allows engineers to move from a trace to related logs.
The three signals complement one another.
Metrics
→ What is happening?

Traces
→ Where is it happening?

Logs
→ Why did it happen?
Example:
Metric:
Payment latency increased

Trace:
Provider call takes 5 seconds

Log:
Provider timeout after 5000 ms
Together, they provide much stronger observability.
Audit logs record security or business-sensitive actions such as:
User changed account permissions
Administrator deleted a customer
Payment configuration changed
API key was created
Audit records may require stronger:
Durability
Access controls
Retention
Actor identification
Tamper resistance
Audit logging should not automatically be treated like ordinary debug logging.
Possible techniques include:
Append-only storage
Restricted write permissions
Immutable object storage
Hash chains
Signed batches
A simplified hash chain:
Hash(Log N + Hash(Log N-1))Changing an older record then breaks the expected chain.
In a shared observability platform, every event should belong to a tenant.
tenant_idQueries must enforce tenant isolation.
Tenant A must never access Tenant B's telemetry.
Multi-tenancy affects:
Authentication
Authorization
Partitioning
Indexing
Retention
Billing
Quotas
Useful quotas include:
Events/sec
Bytes/sec
Active metric series
Query concurrency
Daily storage
A noisy tenant can also create hot partitions.
Therefore:
Large Tenant
     ↓
Rate Limit / Quota
     ↓
Split Across Shards
     ↓
Isolate Expensive Workloads
Tenant isolation is both a security problem and a resource-isolation problem.
Keeping every event forever is often economically impractical.
A policy may retain:
1% of routine successful requests
100% of important errors
Sampling can dramatically reduce cost.
However:
Discarded telemetry cannot be searched later.
Head Sampling
Decide when the trace begins.
Simple and inexpensive, but the system does not yet know whether the request will fail or become slow.
Tail Sampling
Decide after the trace completes.
The system may preserve:
Slow traces
Failed traces
Rare traces
Interesting traces
Tail sampling provides better diagnostic value but requires more buffering and processing.
Suppose producers generate:
15 million logs/secwhile the backend can process:
10 million logs/secThe backlog grows by:
5 million logs/secInitially:
Traffic Spike
     ↓
Broker Buffering
     ↓
Autoscale Consumers
If pressure continues:
Backlog Keeps Growing
        ↓
Throttle / Sample
        ↓
Drop Lower-Value Telemetry
A possible priority order is:
Audit
  >
Error
  >
Warning
  >
Info
  >
Debug
If the broker itself approaches capacity:
Broker Near Capacity
        ↓
Increase Sampling
        ↓
Throttle Producers Where Safe
        ↓
Spill to Durable Storage Where Supported
        ↓
Drop Lowest-Priority Telemetry
Buffers are finite.
There is no zero-cost solution once every buffer is full.
For ordinary telemetry, blocking the application's critical business path should usually be avoided.
Ingestion and querying should scale independently.
The write path is:
Agent
  ↓
Collector
  ↓
Broker
  ↓
Processor
  ↓
Storage
The read path is:
User / Dashboard
       ↓
    Query API
       ↓
Query Coordinator
       ↓
 +-----+-----+-----+
 ↓     ↓     ↓     ↓
Shard Shard Shard Shard
 \     |     |     /
       ↓
 Merge Results
The coordinator identifies relevant shards, queries them in parallel, and merges the results.
Most log searches specify a time range.
Useful dimensions include:
Time
Tenant
Service
Hash
A practical key might be:
tenant + time bucket + hash shardTime helps avoid scanning irrelevant historical data.
Hash sharding helps distribute large tenants.
Most incident investigations search recent data.
Show errors from last 10 minutesis generally much more common than:
Show errors from 9 months agoThis is another reason for hot/warm/cold storage.
The query layer must also protect itself from requests such as:
Search all logs
for the last 12 months
using full-text pattern matching
Use:
Query timeouts
Scan limits
Result limits
Concurrency limits
Per-tenant quotas
Query-cost controls
Repeated metric/dashboard queries may also be cached.
Telemetry passes through several stages before it becomes searchable:
Generated → Buffered → Processed → Indexed → SearchableAspect | Normal Operation | During Overload |
|---|---|---|
Ingestion | Events are accepted normally | Events should continue to be accepted |
Buffering | Small backlog | Larger backlog in durable buffer |
Processing | Keeps up with ingestion | May fall behind |
Indexing | Happens quickly | Can be delayed |
Search Freshness | Recent events searchable within seconds | Recent events may appear later |
Preferred Behavior | Fast ingestion and search | Preserve telemetry rather than drop accepted events |
For many observability systems, delayed search is better than losing accepted telemetry. However, excessive delay can make monitoring and debugging ineffective.
A useful metric is:
searchable_latency = searchable_time - event_timeThe key trade-off is to preserve durable ingestion during temporary overload while keeping search latency within an acceptable limit.
A production observability platform should assume components will fail.
Agent Failure: Application continues; agent resumes collection where possible.
Collector Failure: Traffic moves to another collector.
Broker Failure: Replicated partitions preserve availability where possible.
Processor Failure: Work can be retried from durable buffered data.
Storage Slowdown: Broker temporarily absorbs backlog.
Search Failure: Ingestion continues even if queries are unavailable.
Alert Evaluator Failure: Another evaluator should take ownership.
The major layers should fail independently whenever possible.
A dangerous architecture occurs when the monitoring platform completely depends on the same infrastructure it monitors.
For example, if both production and monitoring depend on the same failing database, cluster, or network path, both can disappear during the same outage.
Critical observability infrastructure should have enough independence to report major production failures.
This does not mean duplicating the entire platform.
It means avoiding obvious shared single points of failure.
An observability platform needs observability too.
Monitor:
Ingestion throughput
Dropped telemetry
Broker lag
Collector failures
Storage failures
Query latency
Searchable latency
Alert evaluation delay
Alert delivery failures
Disk capacity
Metric cardinality
For example:
Expected ingestion:
10 million events/sec

Observed ingestion:
3 million events/sec
Either the application became unusually quiet or the telemetry pipeline is losing data.
Meta-monitoring helps distinguish these cases.
Different telemetry signals have different access patterns.
Signal | Main Access Pattern | Storage Characteristics |
|---|---|---|
Logs | Search/filter fields and time ranges | Append-heavy, searchable, compressed |
Metrics | Aggregate labels over time | Time-series optimized, compact |
Traces | Trace/span lookup and relationships | Trace-oriented relationship lookup |
Relational databases may still work well for:
Alert configuration
User accounts
Tenant metadata
Dashboard definitions
Retention policies
The important question is not:
SQL or NoSQL?
It is:
Which storage model matches this access pattern?
At large scale, forcing logs, metrics, and traces into one generic relational table is usually not ideal.
Suppose one request touches:
Order Service
Payment Service
Inventory Service
Each service logs:
Order:
request_id=req_123 order created

Payment:
request_id=req_123 payment successful

Inventory:
request_id=req_123 stock reserved
Searching:
request_id=req_123reconstructs the request across services.
The ID must propagate downstream:
Client
  ↓ request_id=req_123
API Gateway
  ↓
Order Service
  ↓
Payment Service
For distributed tracing, propagate trace context as well.
Suppose Payment Service generates:
Provider timeoutThe complete path is:
Payment Service
      ↓
Local Log
      ↓
Log Agent
      ↓
Collector
      ↓
Durable Broker
      ↓
Parser / Processor
      ↓
Searchable Log Store
      ↓
Query Service
      ↓
Engineer
The processing pipeline may also derive:
payment_provider_errors_totalwhich can participate in monitoring and alerting.
Suppose Payment Service exposes:
payment_errors_total
request_latency
active_requests
The monitoring path is:
Payment Service
      ↓
Metric Collector
      ↓
Time-Series Database
      |
   +--+-----------+
   |              |
   v              v
Dashboard    Alert Evaluator
                  ↓
             Alert Manager
                  ↓
              On-Call
This path is optimized for numeric time-series aggregation rather than full-text search.
                    APPLICATIONS / INFRASTRUCTURE
                              |
             +----------------+----------------+
             |                |                |
             v                v                v
        Log Agents      Metric Exporters   Trace SDKs
             |                |                |
             v                v                v
       Log Collectors   Metric Collectors Trace Collectors
             |                |                |
             v                v                v
       Durable Broker        TSDB          Trace Store
             |
             v
       Log Processors
             |
       +-----+------+
       |            |
       v            v
   Hot Log Store  Cold Archive
       |
       v
   Log Query API

              QUERY / OBSERVABILITY LAYER

   Log Store        TSDB         Trace Store
       \              |              /
        \             |             /
         +------------+------------+
                      |
                      v
                  Query Layer
                      |
          +-----------+-----------+
          |                       |
          v                       v
      Dashboards              Investigation

                   ALERTING

                     TSDB
                      |
                      v
              Alert Rule Evaluator
                      |
                      v
                Alert Manager
                      |
          +-----------+-----------+
          |           |           |
          v           v           v
        Chat        Email       Pager
The architecture intentionally keeps log ingestion, metric collection, tracing, querying, and alerting as distinct concerns while allowing them to work together.
A strong design should explain the decisions behind the architecture.
Synchronous vs Asynchronous Logging: Synchronous logging can provide stronger immediate acknowledgement but adds latency and failure coupling. Ordinary application logging usually favors asynchronous collection.
Index Everything vs Selective Indexing: More indexes improve search flexibility but increase storage, CPU, memory, and write amplification.
Full Retention vs Cost: Longer retention improves historical investigation but increases storage cost significantly.
Push vs Pull Metrics: Push fits some workloads naturally; pull provides centralized control and useful scrape-health semantics.
Accuracy vs Sampling: Keeping everything maximizes visibility; sampling reduces cost but permanently discards some telemetry.
Durable Ingestion vs Search Freshness: During temporary overload, preserving events can be more important than immediate indexing.
Shared Infrastructure vs Tenant Isolation: Shared infrastructure is efficient, but quotas and partition isolation are required to control noisy neighbors.
High Resolution vs Storage Cost: Fine-grained metrics provide better diagnostics but require more storage; downsampling reduces cost at the expense of detail.
Area | HLD | LLD |
|---|---|---|
Focus | Distributed observability platform | Internal logging-library design |
Collection | Agents, collectors, ingestion | Logger and appender classes |
Storage | Log store, TSDB, trace store | Sink abstractions |
Scalability | Partitioning, replication, retention | Object and interface design |
Failure Handling | Buffering, HA, backpressure | Component-level retry behavior |
Main Question | How does telemetry flow and scale? | How is a logger implemented in code? |
Possible LLD abstractions:
Logger
  |
  +-- ConsoleAppender
  +-- FileAppender
  +-- RemoteAppender
and:
Formatter
  |
  +-- TextFormatter
  +-- JSONFormatter
In interviews, clarify whether the interviewer wants a logger library LLD or a distributed observability platform HLD.
A logging and monitoring system should evolve gradually as traffic, reliability needs, and operational complexity increase.
Stage | System Scale | What We Add |
|---|---|---|
Stage 1 | Small Application | Local log files and basic host-level metrics |
Stage 2 | Multiple Servers | Log agents, centralized log storage, and basic monitoring |
Stage 3 | Growing Traffic | Collectors, durable broker, searchable log storage, time-series database, dashboards, and alerts |
Stage 4 | Large Distributed System | Partitioning, replication, tiered storage, service discovery, distributed tracing, sampling, and retention controls |
Stage 5 | Internet Scale | Multi-region ingestion, tenant isolation, cardinality controls, query federation, SLO monitoring, advanced alerting, and large-scale aggregation |
The architecture evolves roughly as:
Local Logging
      ↓
Centralized Logging
      ↓
Scalable Ingestion and Monitoring
      ↓
Distributed Observability Platform
      ↓
Multi-Region Observability
The key principle is:
Start simple and add complexity only when scale, reliability, or business requirements demand it.
Use local agents so application requests do not depend on the centralized logging platform.
Send logs through horizontally scalable collectors into durable buffering. Process and index them into searchable storage while moving older data to cheaper storage.
Collect metrics separately into a TSDB and use them for dashboards and alert evaluation. Add tracing, partitioning, sampling, retention, and multi-tenancy as required.
Logging records individual events with detailed context.
Monitoring measures aggregated system behavior over time.
Logs help investigate why something happened, while monitoring helps detect what is happening.
Distributed systems generate logs across many machines and services.
Centralized logging lets engineers search and correlate those events without manually connecting to every machine.
Run lightweight agents close to applications.
Agents read local files or container output, batch and compress events, buffer temporary failures, and forward telemetry to horizontally scalable collectors.
A broker decouples ingestion from processing and storage.
If indexing becomes temporarily slower than incoming traffic, the broker absorbs the backlog instead of immediately propagating the failure to producers.
Use:
Partitioned ingestion
Batching
Compression
Distributed storage
Selective indexing
Retention policies
Tiered storage
Sampling
The system should scale horizontally rather than depend on one database node.
Time is important because most searches specify a time range.
Tenant and hashing can also be used.
For example:
tenant + time bucket + hash shardThis provides time pruning while distributing large tenants.
Structured logging stores machine-readable fields instead of putting everything into one text string.
{
  "service": "checkout",
  "level": "ERROR",
  "error_code": "DB_TIMEOUT"
}
This makes filtering and aggregation easier.
Use asynchronous logging, local buffering, batching, and agents.
Ordinary business requests should not wait for the centralized logging backend.
Buffer temporarily at agents or brokers and retry where appropriate.
If capacity is eventually exhausted, apply an explicit degradation policy such as increased sampling or dropping low-priority telemetry while preserving critical events.
High cardinality occurs when metric labels contain huge numbers of unique values.
Values such as user_id or request_id can create millions of time series.
Those identifiers generally belong in logs or traces instead.
Evaluate rules against metrics, track alert state, require important conditions to persist for an appropriate duration, deduplicate related alerts, and route them to the correct team.
Support grouping, inhibition, and silencing to control alert noise.
Use meaningful thresholds, persistence windows, grouping, deduplication, inhibition, severity levels, and actionable alert definitions.
An alert should generally mean someone needs to take action.
Metric queries are naturally organized around:
Metric
+
Labels
+
Time Range
TSDBs are designed for high metric ingestion, compression, time-based retention, and aggregate range queries.
Keep recent logs in fast searchable storage.
Move older data to cheaper storage and eventually delete it according to retention requirements.
Distributed tracing follows a request through multiple services using shared trace context.
Each operation creates a span.
It helps identify where latency or failure occurred.
Metrics → What is happening?
Traces  → Where is it happening?
Logs    → Why did it happen?
Together they provide stronger observability.
Collect latency distributions using histogram-style metrics rather than only averages.
Monitor appropriate percentiles such as P50, P95, and P99.
Use:
Broker buffering
Batching
Autoscaling
Backpressure
Sampling
Priority-aware dropping
Protect important audit and error telemetry before low-value debug logs.
Remove single points of failure across collectors, brokers, processors, storage, query services, and alert evaluators.
Also separate ingestion availability from query availability so a search outage does not automatically cause telemetry loss.
Monitor ingestion rate, dropped telemetry, broker lag, collector health, storage failures, query latency, searchable latency, alert evaluation delay, delivery failures, cardinality, and disk capacity.
The monitoring system must monitor itself.
Avoid logging secrets in the first place.
Redact sensitive fields as early as possible and use encryption, access controls, audit trails, and appropriate retention policies.
Sampling keeps only part of a high-volume telemetry stream.
For example:
Keep 1% of routine successful-request logs
Keep important errors
It reduces cost but sacrifices complete historical visibility.
Correlation IDs connect events from different services belonging to the same logical request.
They make distributed debugging significantly easier.
At large scale, observability requires balancing:
Visibility
Reliability
Storage Cost
Search Speed
Freshness
Cardinality
Performance
Collecting everything forever with full indexing is usually economically impractical.
Common mistakes include:
Sending remote logs synchronously from the critical request path.
Indexing every field without considering cost.
Having no buffering, backpressure, or overload policy.
Keeping telemetry indefinitely without retention or tiered storage.
Using unbounded values such as user_id as metric labels.
Monitoring only average latency instead of tail latency.
Missing alert deduplication, suppression, and actionable routing.
Logging secrets or sensitive information.
Ignoring tenant isolation and noisy-neighbor problems.
Treating logs, metrics, and traces as if they had identical storage and query requirements.
