
Durgesh Tiwari
Author
An Ad Click Aggregator collects click events when users interact with advertisements and converts those events into useful metrics for advertisers.
At a small scale, counting clicks looks simple:
User Clicks Ad
      ↓
Increment Counter
      ↓
Show Count
At large scale, the problem becomes much harder.
Millions of ads can generate hundreds of millions or even billions of click events. Advertisers expect dashboards to update within seconds, while the system must handle traffic spikes, avoid losing events, and prevent duplicate clicks from affecting the metrics.
The main problem becomes:
How do we ingest a huge number of click events,
aggregate them in near real time,
and answer analytics queries quickly
without losing or double-counting events?
That is the core problem in Ad Click Aggregator System Design.
An Ad Click Aggregator takes individual ad click events and turns them into aggregated metrics that advertisers can easily query.
Suppose a user sees an advertisement:
+-------------------------+
|                         |
|      Running Shoes      |
|                         |
|       Buy Now           |
|                         |
+-------------------------+
When the user clicks the ad, the system generates a click event:
{
  "event_id": "evt_123",
  "ad_id": "ad_456",
  "impression_id": "imp_789",
  "timestamp": "2026-09-19T10:15:32Z"
}
A single click event is not very useful by itself. Advertisers usually want aggregated metrics such as:
Ad 456

10:15 → 1,230 clicks
10:16 → 1,415 clicks
10:17 → 1,387 clicks
10:18 → 1,502 clicks
They may want to know:
How many clicks did my ad receive today?
How many clicks did it receive each minute?
Which campaign generated the most clicks?
How is the campaign performing right now?
Instead of making advertisers query millions of individual events, the system continuously converts raw click events into smaller, query-friendly metrics.
An Ad Click Aggregator is mainly a high-volume event-processing and real-time analytics system.
High-Volume Event Ingestion
          +
Stream Processing
          +
Time-Window Aggregation
          +
Analytics Storage
The number of incoming click events is usually much higher than the number of advertiser dashboard queries.
For example:
Millions of Click Events
          ↓
Continuous Aggregation
          ↓
Much Smaller Metrics Dataset
          ↓
Advertiser Queries
So the main scaling challenge is not serving millions of dashboard requests.
It is handling a very large write stream, processing events continuously, and keeping analytical results fresh.
An Ad Click Aggregator is primarily a write-scaling and stream-processing system that converts high-volume click events into near-real-time analytics.
The core system should support the complete click-to-metrics flow.
Record ad click events.
Redirect users to the advertiser's destination.
Aggregate clicks by ad or campaign.
Support metrics over a given time range.
Provide at least minute-level aggregation.
Prevent duplicate events from incorrectly increasing counts.
Preserve raw events for recovery and reconciliation.
Features such as ad targeting, auctions, creative selection, conversion attribution, advanced fraud detection, billing, and cross-device tracking are outside the initial scope.
At scale, the system should provide:
High write throughput.
Very low click-path latency.
Near-real-time analytics.
Fault tolerance.
No silent event loss.
Duplicate protection.
Low-latency analytics queries.
Horizontal scalability.
Durable event storage.
Strong observability.
The most important requirement is keeping the click path fast. Every additional synchronous dependency can delay the user's redirect to the advertiser.
Assume the platform receives:
100 million clicks/dayThe average event rate is:
100,000,000 / 86,400

≈ 1,157 clicks/second
Traffic is rarely uniform. If peak traffic is around 10× the average:
Peak ≈ 10,000–12,000 clicks/secondNow assume each click event is about:
200 bytesThe raw event volume is roughly:
100,000,000 × 200 bytes

≈ 20 GB/day
This is only the raw event size. Replication, indexes, metadata, and storage overhead will increase the actual storage requirement.
The main design implication is:
The system receives far more click events than advertiser queries, so the architecture should be optimized for high-throughput ingestion and continuous aggregation.
The system receives individual click events and produces aggregated metrics.
A click event may contain:
ad_id
impression_id
campaign_id
timestamp
device_type
Advertisers query aggregated results for an ad or campaign over a time range.
For example:
ad_id      = 123
from       = 10:00
to         = 11:00
granularity = 1 minute
Possible result:
[
  {"minute": "10:00", "clicks": 1021},
  {"minute": "10:01", "clicks": 1087},
  {"minute": "10:02", "clicks": 1134}
]
Conceptually:
Raw Click Events
       ↓
Aggregation System
       ↓
Advertiser Metrics
The interface looks simple, but the main challenge is processing a very large event stream while keeping these metrics fresh and accurate.
The architecture separates the latency-sensitive click path from asynchronous analytics processing. The user should reach the advertiser quickly, while aggregation and reporting happen in the background.
                     USER
                       |
                     CLICK
                       |
                       v
                CLICK SERVICE
                   |       |
                   |       +------→ 302 Redirect
                   |                    |
                   v                    v
             DURABLE STREAM       ADVERTISER SITE
                   |
          +--------+--------+
          |                 |
          v                 v
   STREAM PROCESSOR    RAW EVENT ARCHIVE
          |                 |
          v                 v
  REAL-TIME AGGREGATES   DATA LAKE
          |                 |
          v                 v
     ANALYTICS DB      BATCH PROCESSOR
          ^                 |
          |                 |
          +---- RECONCILIATION
          |
          v
    METRICS SERVICE
          |
          v
 ADVERTISER DASHBOARD
This creates two important processing paths:
Real-time path: Click events move through the stream processor and update pre-aggregated metrics for fresh dashboard results.
Raw-data path: Original events are archived so metrics can be recomputed and corrected if the real-time pipeline produces incorrect results.
The Analytics DB remains the main query store. Reconciliation verifies or corrects its aggregates using results rebuilt from the raw event archive.
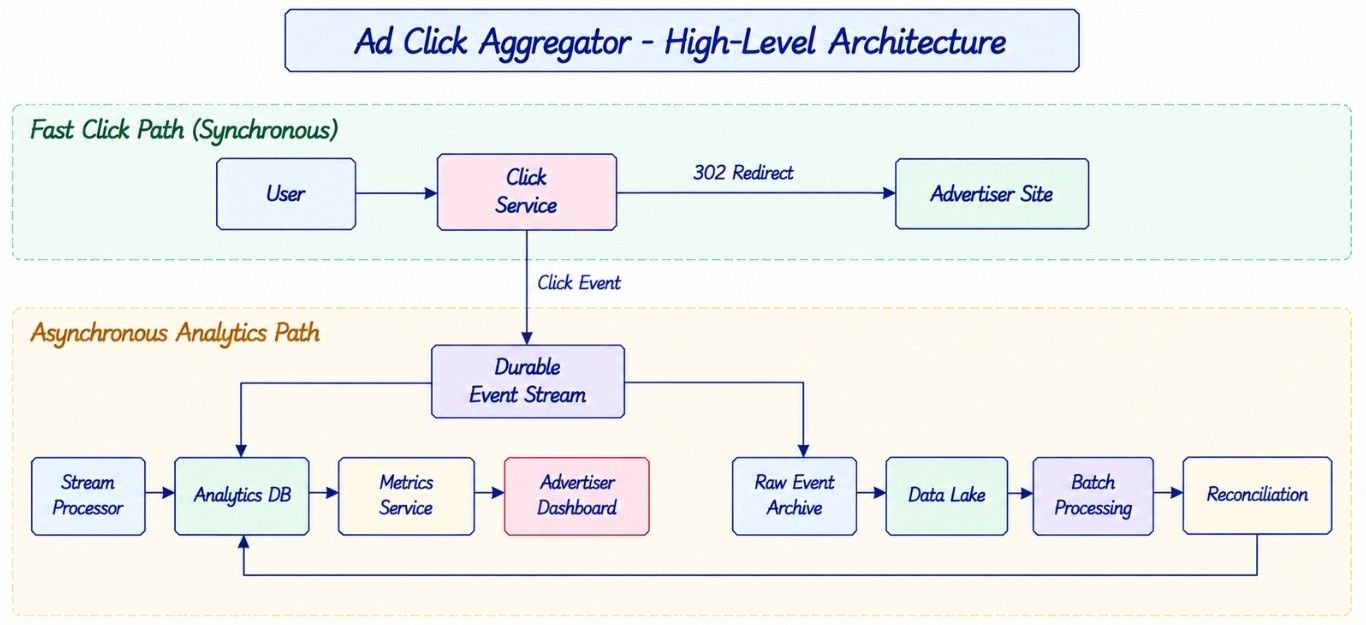
The platform must receive the click before the user reaches the advertiser.
If the ad links directly to:
advertiser.com/productour tracking system may never see the click.
Instead, the browser first calls the Click Service:
User
 ↓
Tracking URL
 ↓
Click Service
 ↓
302 Redirect
 ↓
Advertiser Site
A tracking request may look like:
GET /click?ad_id=123&impression_id=abc&signature=xyzThe Click Service validates the tracking information, durably publishes the click event, and returns a redirect:
HTTP/1.1 302 Found
Location: <https://advertiser.example/product>
This allows the platform to capture the click while still sending the user to the intended destination.

Redirect latency directly affects the user experience, so the synchronous click path should contain as little work as possible.
Avoid this:
Click
 ↓
Database
 ↓
Aggregation
 ↓
Fraud Detection
 ↓
Analytics
 ↓
Redirect
Every synchronous dependency increases latency and creates another point of failure.
A better flow is:
Click
 ↓
Validate
 ↓
Durably Publish Event
 ↓
Redirect User

      Event Stream
           ↓
   Async Processing
Aggregation, analytics, fraud detection, archival, and reporting should normally happen asynchronously after the click event is safely captured.
Keep the synchronous path focused on validation, durable event capture, and redirect. Move everything else to asynchronous processing.
A simple design could store every click event in a database:
ClickEvent
----------
event_id
ad_id
impression_id
timestamp
The dashboard could then calculate the total clicks using a query such as:
SELECT COUNT(*)
FROM click_events
WHERE ad_id = ?
  AND timestamp BETWEEN ? AND ?;
This works at small scale.
At large scale, the database may contain hundreds of millions or billions of click events. Running aggregation queries directly on raw data for every dashboard request becomes expensive.
For example:
Dashboard Request
       ↓
Scan Raw Click Events
       ↓
Filter by Ad + Time
       ↓
COUNT / Aggregate
       ↓
Return Metrics
The same aggregation work may be repeated every time an advertiser refreshes the dashboard.
Raw events are useful for recovery and detailed analysis, but they should not be the primary source for common real-time dashboard queries.
Instead of calculating the same metrics repeatedly, the system can aggregate click events continuously as they arrive.
Suppose the raw events are:
ad_123 clicked at 10:00:03
ad_123 clicked at 10:00:07
ad_123 clicked at 10:00:21
ad_123 clicked at 10:00:49
The system can convert them into one minute-level aggregate:
ad_123
10:00
click_count = 4
Now the dashboard reads a small precomputed dataset instead of scanning all individual click events.
For minute-level aggregation, a simple key is:
(ad_id, minute_bucket)For example:
(ad_123, 10:00) → 4,521
(ad_123, 10:01) → 4,687
(ad_123, 10:02) → 4,412
Campaign-level metrics can use:
(campaign_id, minute_bucket)Other dimensions such as country or device type can also be added when required. However, pre-aggregating too many dimensions creates a cardinality explosion, increasing storage and processing costs.
The main idea is simple:
Raw Click Events
       ↓
Continuous Aggregation
       ↓
Precomputed Metrics
       ↓
Fast Dashboard Queries
Pre-aggregate the metrics that advertisers query frequently, while keeping raw events for recovery, reconciliation, and less common analysis.
Writing directly from the Click Service to the analytics database tightly couples the user-facing click path to analytical storage.
Click Service
      ↓
Analytics DB
      X
If the analytics database becomes slow or unavailable, click processing and redirect latency may be affected.
A durable event stream separates ingestion from analytics processing:
Click Service
      ↓
Durable Event Stream
      ↓
Stream Processor
      ↓
Analytics DB
Once the event reaches the required durable acceptance point, the Click Service can redirect the user. Stream processing and analytics continue asynchronously.
The event stream provides:
Durable buffering.
Event replay.
Horizontal partitioning.
Traffic-spike absorption.
Independent consumers.
Separation between ingestion and processing.
It also protects the system during temporary downstream failures:
Click Traffic
     ↓
Durable Stream
     ↓
Processor / Analytics DB Slow
     ↓
Backlog Builds Safely
     ↓
Downstream Recovers
     ↓
Events Catch Up
Systems such as Kafka or Kinesis can provide this role, but the important design decision is the durable asynchronous boundary, not the specific technology.
The event stream protects the click path from slow or temporarily unavailable downstream analytics systems.
Each accepted click is represented as a small event that downstream systems can process independently.
For example:
{
  "event_id": "evt_01",
  "ad_id": "ad_123",
  "campaign_id": "campaign_9",
  "advertiser_id": "advertiser_5",
  "impression_id": "imp_789",
  "event_time": "2026-09-19T10:15:32.415Z",
  "device_type": "mobile",
  "country": "IN",
  "schema_version": 1
}
Important fields have different purposes:
event_id gives the event a stable identity.
ad_id identifies the advertisement.
campaign_id supports campaign-level aggregation.
advertiser_id identifies the advertiser.
impression_id identifies the specific ad impression and helps with deduplication.
event_time records when the click actually happened.
schema_version allows the event format to evolve safely.
Optional dimensions such as device type or country should be included only when downstream reporting needs them.
At billions of events, even a small increase in event size can create significant network and storage cost.
Keep click events small, stable, and easy for downstream consumers to process.
The event stream must be partitioned so multiple processors can consume clicks in parallel.
A natural starting partition key is:
ad_idFor example:
partition = hash(ad_id) % NThis distributes different ads across stream partitions while keeping clicks for the same ad on the same logical partition.
Partition 1 → ads 10, 31, 42
Partition 2 → ads 11, 17, 99
Partition 3 → ads 15, 22, 80
Processing workers can then consume different partitions in parallel:
Event Stream

Partition 1 ──→ Worker A
Partition 2 ──→ Worker B
Partition 3 ──→ Worker C
Keeping an ad's events together simplifies per-ad aggregation and provides partition-level ordering for that ad.
However, this creates an important scaling problem.
If one advertisement becomes extremely popular:
Ad 999
  ↓
One Partition
  ↓
Very High Traffic
that partition can become a hot partition even when other partitions have spare capacity.
We will solve this later using hot-key sharding and two-stage aggregation.
Partitioning by
ad_idis a simple starting point, but the design must also handle ads that become much hotter than the rest.
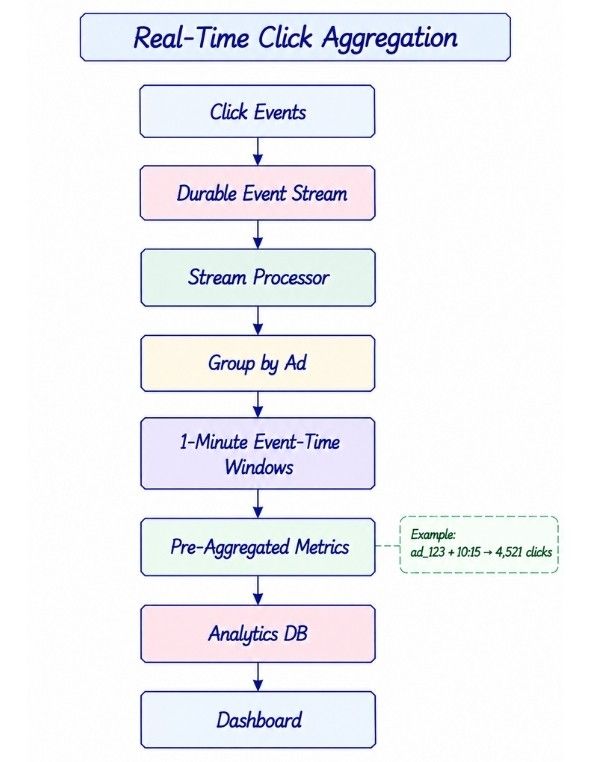
The stream processor continuously consumes click events and converts them into time-based aggregates.
Event Stream
      ↓
Stream Processor
      ↓
Group by Ad
      ↓
Time Window
      ↓
Count Clicks
      ↓
Analytics Store
Suppose we aggregate clicks into one-minute windows:
10:15:00–10:15:59

ad_1 → 450 clicks
ad_2 → 713 clicks
ad_3 → 120 clicks
The aggregation rule is conceptually:
key       = ad_id
window    = 1 minute
aggregate = COUNT
Instead of writing every individual click to the analytics store, the processor maintains a running count for each ad and time window.
This reduces the amount of data the dashboard needs to read and makes common analytics queries much faster.
Click events may not reach the stream processor immediately, so we need to distinguish event time from processing time.
Event time is when the click actually happened.
Processing time is when the stream processor handled the event.
Suppose a click happens at:
10:15:59but reaches the processor at:
10:16:03If we use processing time, the click goes into the 10:16 bucket.
If we use event time, it correctly belongs to:
10:15For analytics, event time usually gives more accurate reporting.
Events can also arrive out of order:
Event A
event time = 10:15:58
arrival    = 10:15:59

Event B
event time = 10:15:50
arrival    = 10:16:04
Event B arrived later, but it still belongs to the 10:15 window.
A stream processor can use a watermark to estimate how far event-time processing has progressed and decide when a window is sufficiently complete.
For example:
Window:
10:15:00–10:16:00

Allowed Lateness:
30 seconds
The processor can continue accepting late events for that window during the allowed-lateness period.
10:15 Window
      ↓
Window Ends at 10:16:00
      ↓
Accept Bounded Late Events
      ↓
Finalize Window
Events arriving after the configured cutoff can be handled through a later correction or reconciliation process.
Use event time for accurate reporting, and use watermarks plus an allowed-lateness policy to handle delayed and out-of-order events.
A one-minute aggregation window does not mean advertisers must wait until the entire minute finishes.
The processor can periodically publish partial results for the current window:
10:15:10 → 520 clicks
10:15:20 → 1,100 clicks
10:15:30 → 1,720 clicks
The count continues to update until the window is finalized.
This gives advertisers fresh metrics within seconds while the system still stores reports using minute-level buckets.
Window size controls reporting granularity, while update frequency controls how quickly new results appear on the dashboard.
The Analytics Database stores pre-aggregated metrics and is optimized for advertiser reporting rather than raw click ingestion.
Typical access patterns include:
Time-range queries.
Filtering by ad, campaign, or advertiser.
Aggregation over large time ranges.
Fast reads over large analytical datasets.
A simple minute-level model is:
AdMinuteMetrics
---------------
ad_id
minute
click_count
For example:
ad_123 | 10:15 | 4,521
ad_123 | 10:16 | 4,812
ad_123 | 10:17 | 4,605
A column-oriented OLAP database is often a good fit because the workload mainly involves analytical reads over time-series metrics.
The important design point is:
Raw click ingestion and advertiser analytics have different access patterns, so they do not need to use the same storage model.
The Metrics Service provides aggregated click data to advertiser dashboards and other reporting clients.
A request may look like:
GET /v1/ads/{ad_id}/metrics?start_time=...&end_time=...&granularity=minuteThe service first verifies that the advertiser is authorized to access the requested ad or campaign.
It then reads the appropriate pre-aggregated data from the Analytics Database:
Advertiser Dashboard
        ↓
   Metrics Service
        ↓
Authorization Check
        ↓
   Analytics DB
        ↓
Aggregated Metrics
Because the expensive aggregation work has already been performed by the stream-processing pipeline, the query path remains relatively simple and fast.
Advertisers may request metrics over very different time ranges:
Last 30 minutes
Last 24 hours
Last 30 days
Last year
Reading minute-level rows for a long period such as an entire year would be inefficient.
The system can maintain multiple rollups:
Minute Aggregates
Hourly Aggregates
Daily Aggregates
The Metrics Service selects the appropriate granularity based on the requested range:
Short Range  → Minute Aggregates
Medium Range → Hourly Aggregates
Long Range   → Daily Aggregates
These additional rollups require some extra processing and storage, but they reduce the amount of data scanned for long-range queries and improve dashboard performance.
Store fine-grained metrics for recent analysis and coarser rollups for efficient long-range reporting.
Pre-aggregated metrics make dashboard queries fast, but the original click events should still be preserved for recovery and reprocessing.
Suppose a faulty stream-processing deployment undercounts clicks for three hours. If only the aggregated metrics are stored, reconstructing the correct counts may be difficult or impossible.
With a raw event archive, the affected events can be processed again:
Raw Event Archive
       ↓
Reprocess Events
       ↓
Rebuild Aggregates
       ↓
Correct Analytics DB
A common architecture is:
                 Event Stream
                /            \
               v              v
      Stream Processor    Archive Sink
               |              |
               v              v
      Real-Time Metrics    Data Lake
                              |
                              v
                       Batch Processing
The archive is designed for cheap, durable storage rather than low-latency dashboard queries.
It supports:
Reprocessing after bugs or failures.
Historical analysis.
Recovery of incorrect aggregates.
Rebuilding metrics when processing logic changes.
Streaming provides fresh metrics, while reconciliation provides a way to detect and repair incorrect results.
Raw Event Archive
       ↓
Batch Processing
       ↓
Recomputed Aggregates
       ↓
Compare with Real-Time Aggregates
       ↓
Detect Differences
       ↓
Correct Analytics DB
For example:
Real-Time Result = 999,830
Recomputed Result = 1,000,000
Difference        = 170
The reconciliation process can detect this difference and correct the stored metrics according to the same deduplication and business rules used by the system.
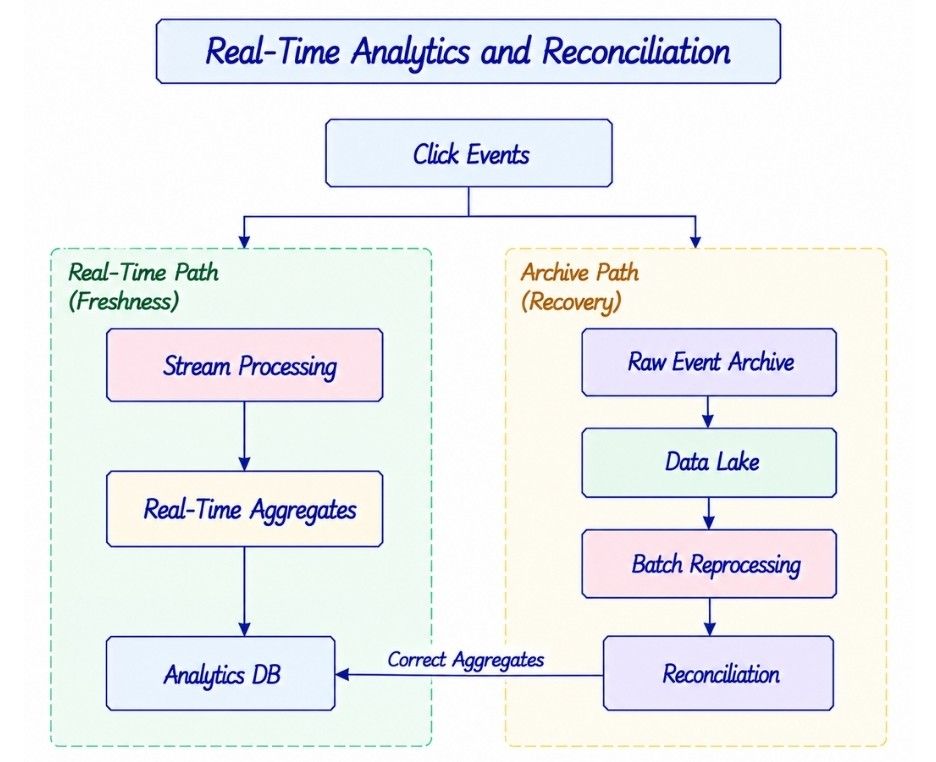
This gives the architecture two complementary paths:
Click Events
   |
   +----→ Stream Processing ──→ Fresh Metrics
   |
   +----→ Raw Archive ────────→ Reprocessing
                                      |
                                      v
                                Reconciliation
                                      |
                                      v
                               Correct Metrics
The real-time path focuses on freshness, while the archive and reconciliation path provides recoverability and correction.
Keep raw events even when dashboards use pre-aggregated data. They allow the system to rebuild and correct metrics when the real-time pipeline fails or produces incorrect results.
In a distributed system, the same logical click may be delivered more than once.
Duplicates can come from:
Browser or network retries.
Client or service retries.
Consumer replay.
Failover and recovery.
Because of this, every click needs a stable identity so repeated processing does not incorrectly increase the metrics.
Using only:
(user_id, ad_id)is not enough for deduplication.
A user may legitimately see the same ad multiple times and click it again later.
Instead, each displayed ad instance receives an impression ID:
User Sees Ad 123

impression_id = IMP-987654
The click then carries:
ad_id        = 123
impression_id = IMP-987654
Repeated click requests for the same impression can now be recognized without blocking legitimate clicks from later impressions.
The client should not be able to create arbitrary impression IDs or change the associated ad.
When the impression is created, the server can sign information such as:
ad_id + impression_id + expiryConceptually:
signature = HMAC(secret, payload)The click request carries:
ad_id
impression_id
expiry
signature
The Click Service verifies the signature before accepting the click.
This prevents clients from freely forging or modifying impression information. However, a valid signature does not prove that the click came from a real human or that it should be billable. Fraud detection remains a separate problem.
If the system performs request-level deduplication, it may store:
impression_id → already_clickedA separate read followed by a write is unsafe:
CHECK
  ↓
Not Present
  ↓
INSERT
Two concurrent requests could both see that the impression is missing and both accept the click.
Instead, the dedup store needs an atomic conditional operation such as:
SET IF NOT EXISTSOnly one request can successfully claim the key.
Deduplication records usually need to exist only for the meaningful retry or replay period, so TTL-based storage can be used where appropriate.
Deduplication and durable event capture must be ordered carefully. Otherwise, the system can accidentally lose a legitimate click.
Approach | Flow | Failure Risk | Result |
|---|---|---|---|
Unsafe | Deduplicate → Publish | Publication fails after the click is marked as processed | Retry is rejected and the click is lost |
Safer | Publish durably → Deduplicate during processing | Event may be delivered more than once | Idempotent processing prevents double counting |
Atomic coordination | Deduplication + publication are coordinated atomically | More implementation complexity | Stronger consistency when supported |
The unsafe case looks like this:
1. Mark impression as processed
2. Publish click event
3. Publication fails
4. Retry arrives
5. Retry is rejected as duplicate
The event was never durably captured, so the click is permanently lost.
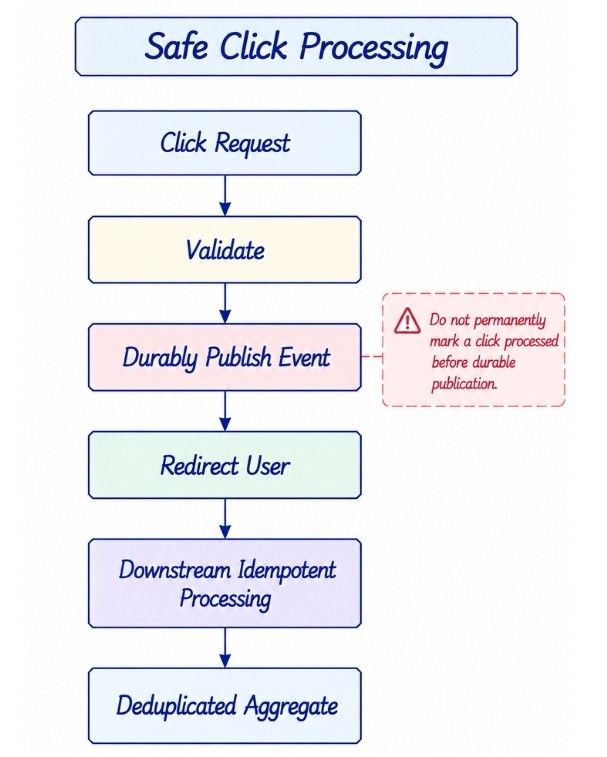
A safer general flow is:
Validate
   ↓
Durably Publish Event
   ↓
Redirect User
   ↓
Downstream Idempotent Processing
The downstream processor uses a stable event_id or impression_id to ensure replayed events do not increase the aggregate more than once.
Never permanently suppress a click before the event itself has been captured durably.
Event streams commonly use at-least-once delivery, which means an event can be delivered again after failures or recovery.
For example:
Consumer Crash
Offset Replay
Retry
Failover
Consumers should therefore be idempotent and use stable identifiers such as event_id or impression_id, depending on the business rule being enforced.
Some stream-processing platforms provide exactly-once semantics within specific source, processing-state, and sink boundaries.
That does not guarantee exactly-once behavior across the complete system:
Browser
   ↓
Click Service
   ↓
Durable Stream
   ↓
Stream Processor
   ↓
Analytics DB
For an end-to-end ad click system, a practical correctness model combines:
Stable Event IDs
       +
Idempotent Processing
       +
Durable Event Stream
       +
Checkpoint Recovery
       +
Reconciliation
This approach accepts that retries and duplicate delivery can happen, while ensuring they do not silently corrupt the final click metrics.
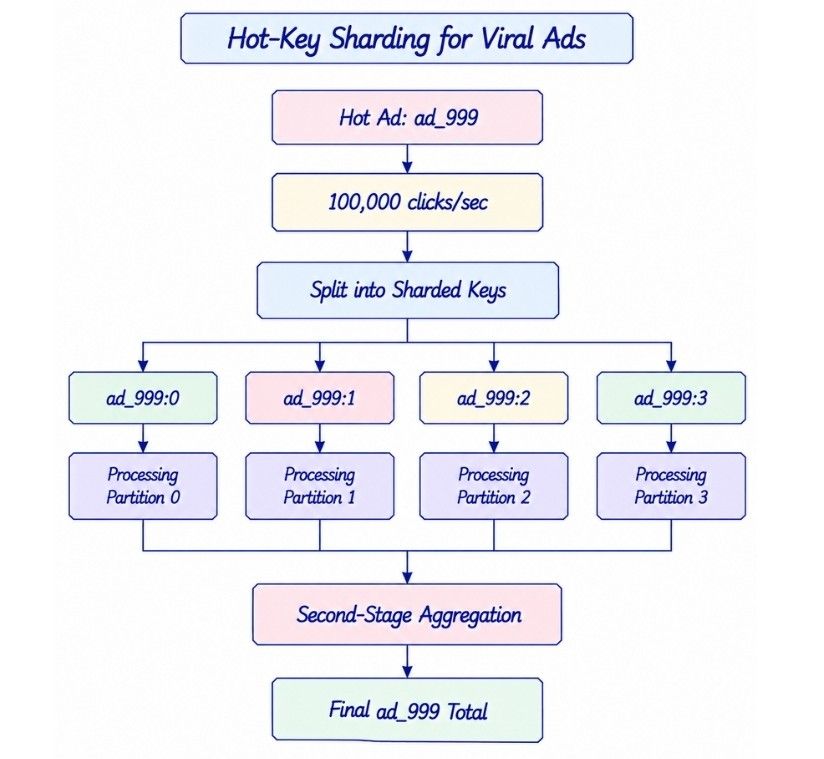
Partitioning by ad_id works well when traffic is reasonably distributed, but a very popular ad can overload a single partition.
Suppose:
Ad 999
→ 100,000 clicks/second
If every click for that ad uses the same partition key:
Ad 999
   ↓
Partition 7
   ↓
OVERLOADED
Other partitions may still have spare capacity, but the hot partition limits overall processing speed.
A hot ad can be distributed across multiple partitions by adding a sub-shard to the partition key.
partition_key = ad_id + sub_shardFor example:
ad_999:0
ad_999:1
ad_999:2
...
ad_999:15
Each shard computes a partial aggregate:
ad_999:0 → 1,000 clicks
ad_999:1 → 1,100 clicks
ad_999:2 →   950 clicks
A second aggregation stage combines these partial results:
           Ad 999 Clicks
                ↓
     +----------+----------+
     |          |          |
     v          v          v
    S0         S1         S2 ...
     |          |          |
     +----------+----------+
                ↓
         Second-Stage Reduce
                ↓
           Final Ad Total
This technique is commonly called hot-key sharding or key salting.
It adds another aggregation step, but prevents one popular ad from becoming limited by a single stream partition.
Even after partitioning the workload, writing every individual click to the Analytics Database would create unnecessary write pressure.
Instead of:
10,000 Clicks
     ↓
10,000 Database Writes
the stream processor can combine clicks locally before writing:
10,000 Clicks
     ↓
Local Aggregation
     ↓
(ad_123, 10:15) += 10,000
     ↓
Much Fewer Database Writes
This reduces write amplification and lowers load on the Analytics Database.
Depending on the database and concurrency model, the sink can use safe upserts or write immutable partial aggregates that are combined later.
Hot-key sharding distributes processing load across partitions, while local pre-aggregation reduces the number of writes reaching the analytics store.
The stream processor may keep temporary aggregation state while processing events.
For example:
(ad_123, 10:15) = 4,520 clicksIf the processor crashes, this state should be recoverable instead of rebuilding everything from the beginning.
The processor can periodically save its state in a durable checkpoint:
Processor State
      ↓
Durable Checkpoint
After a restart:
Load Checkpoint
      ↓
Resume Stream Processing
For small aggregation windows, replaying retained events may also be enough to rebuild the required state.
Checkpointing restores processor state, while stream retention keeps the original events available for replay.
Processor Down
      ↓
Events Remain in Stream
      ↓
Processor Restarts
      ↓
Restore State + Replay Events
      ↓
Catch Up
The retention period should be long enough to cover expected outages and recovery time. Longer retention improves replay capability but increases storage cost.
Consumer lag shows whether processors are keeping up with incoming click traffic.
Suppose:
Input  = 10,000 events/second
Output = 8,000 events/second
The backlog grows by:
10,000 - 8,000
= 2,000 events/second
Important metrics include:
Consumer lag.
Oldest unprocessed event age.
Events received per second.
Events processed per second.
Event-to-query latency.
Consumer lag shows pipeline health, but event-to-query latency is more meaningful for advertiser experience because it measures how long an accepted click takes to appear in queryable metrics.
Backpressure occurs when downstream components cannot process events as quickly as they arrive.
The durable stream provides a buffer during temporary traffic spikes or downstream slowdowns:
Traffic Spike
     ↓
Durable Stream
     ↓
Backlog Grows
     ↓
Processors Scale / Recover
     ↓
Backlog Drains
The system can respond using:
Autoscaling.
Batch processing.
Larger or less frequent aggregate flushes.
Workload isolation.
Admission controls for non-critical work.
Backpressure should be absorbed mainly by the asynchronous processing pipeline. The latency-sensitive click path should remain protected as long as the durable event stream can continue accepting events.
Checkpointing restores processing state, retention enables replay, and lag tells us whether the system is falling behind.
Stream partitioning and analytics storage do not need to use the same partition key because they serve different access patterns.
The event stream may partition by:
ad_idThis helps distribute click processing and keeps events for the same ad together.
Advertiser queries usually follow a different pattern:
Advertiser
    +
Campaign / Ad
    +
Time Range
So the Analytics Database may organize or partition data around:
advertiser_id + timeConceptually:
Event Stream
partition by ad_id
      ↓
Stream Processing
      ↓
Analytics DB
partition / organize for advertiser + time queries
The exact storage key depends on the chosen database and query patterns. The important point is that stream partitioning and query partitioning solve different problems.
The system should also provide tenant isolation. A large advertiser running expensive queries should not make dashboards slow for everyone else.
Useful controls include:
Per-tenant rate limits.
Query quotas.
Resource isolation.
Data partitioning.
Separate treatment for very large tenants.
Partition the stream for efficient event processing and organize the analytics store for efficient advertiser queries.
Ad metrics are naturally time-based, so organizing analytical data by time makes queries and data management more efficient.
For example:
2026-09-17
2026-09-18
2026-09-19
A query for today's metrics can read only the relevant time partitions instead of scanning years of historical data.
Time-based organization also helps with:
Retention.
Archival.
Compaction.
Data deletion.
Different storage layers can keep data for different periods:
Data Layer | Example Retention | Purpose |
|---|---|---|
Event Stream | Days | Replay and short-term recovery |
Raw Event Archive | Months | Reprocessing and reconciliation |
Minute Aggregates | Months to a year | Detailed recent analytics |
Daily Aggregates | Multiple years | Long-term reporting |
These periods are examples, not fixed requirements. Actual retention depends on product needs, storage cost, recovery requirements, and compliance policies.
Keep detailed data where it is useful, and retain coarser aggregates longer for efficient historical reporting.
The simplest real-time aggregate may use:
(ad_id, minute)Over time, reporting requirements may add more dimensions:
country
device
browser
city
placement
campaign
publisher
If the system precomputes every possible combination, the number of aggregate keys can grow rapidly:
ad
× country
× device
× browser
× city
× minute
This increases processing, state, and storage costs even when many combinations are rarely queried.
A better approach is:
Pre-Aggregate Common Dimensions
             +
Keep Detailed Raw Events
             +
Use OLAP for Flexible Analysis
For example:
Use Case | Aggregation Strategy |
|---|---|
Real-time dashboard |
|
Common reporting |
|
Flexible historical analysis | Query detailed data using OLAP or offline processing |
This keeps common dashboard queries fast without precomputing every possible dimension combination.
Pre-aggregate common query patterns, not every possible combination of dimensions.
Counting total clicks is simple because every accepted click can increment a counter.
Total Clicks = COUNT(*)Unique clicks are harder because the system must remember which identities have already been counted within the required time window.
The first step is defining what unique means:
Unique users?
Unique impressions?
Unique devices?
For example, exact unique users conceptually require:
COUNT(DISTINCT user_id)At large scale, maintaining exact sets for many ads and time windows can require significant memory and storage.
If exact counts are required, the system needs scalable state for tracking distinct identities.
If approximate counts are acceptable, probabilistic structures such as HyperLogLog (HLL) can estimate cardinality using much less memory.
The product requirement should therefore answer an important question:
Do we need exact unique counts
or is an approximate count acceptable?
Exact distinct counting provides stronger accuracy but requires more state, while approximate counting can greatly reduce memory at large scale.
If the platform also tracks ad impressions, it can calculate Click-Through Rate (CTR).
CTR = Clicks / ImpressionsFor example:
Impressions = 100,000
Clicks      =   2,000

CTR = 2%
The architecture can process both event types:
Impression Stream ──→ Impression Aggregation ──┐
                                               ├─→ CTR Metrics
Click Stream ───────→ Click Aggregation ───────┘
Impression traffic can be much larger than click traffic, so it may become the main source of ingestion load.
For aggregate CTR, clicks and impressions can often be aggregated independently using compatible dimensions and time windows:
(ad_id, minute) → click_count
(ad_id, minute) → impression_count
The Metrics Service can then calculate CTR from these aggregates.
If the product requires impression-level correlation, clicks and impressions may instead be matched using:
impression_idThis introduces additional complexity such as stateful joins, retention windows, late events, and out-of-order processing.
For a basic Ad Click Aggregator design, impression processing should be added only when CTR or impression-level reporting is required.
Not every recorded click should necessarily be treated as a valid or billable click.
Fraud detection may identify:
Bots and automated scripts.
Click farms.
Suspicious repeated clicks.
Publisher fraud.
Fraud analysis should normally happen asynchronously:
             Click Stream
              /        \
             v          v
      Aggregation   Fraud Detection
The user-facing redirect path should not wait for expensive fraud analysis.
A mature advertising platform may maintain different click metrics:
raw_clicks
     ↓
deduplicated_clicks
     ↓
valid_clicks
     ↓
billable_clicks
For example:
Raw Clicks         = 10,000
Duplicates         =    200
Suspicious Clicks  =    300
Valid Clicks       =  9,500
Fraud decisions can later update reporting or billing according to the product's business rules.
Keep raw, deduplicated, valid, and billable click semantics clearly defined so different systems do not report different meanings for the same metric.
Click events can contain privacy-sensitive information such as user identifiers, IP addresses, device identifiers, locations, and behavioral data.
The system should apply:
Data minimization.
Encryption in transit and at rest.
Strong access controls.
Appropriate retention policies.
Audit logging.
Advertisers should receive only the data they are authorized to access rather than unrestricted raw user-level click records.
The public Click Service should also use:
TLS.
Rate limiting.
Request validation.
Signed impression tokens.
Payload-size limits.
Bot and abuse protection.
Advertiser-facing APIs require authentication and authorization so one advertiser cannot access another advertiser's metrics.
The Click Service must also prevent open redirects.
The browser should not be allowed to provide an arbitrary destination such as:
/click?redirect=https://evil.exampleInstead, the destination should come from trusted server-side ad metadata:
ad_id
  ↓
Trusted Ad Metadata
  ↓
Approved Destination URL
  ↓
302 Redirect
A securely signed destination mapping can also be used when the destination must travel with the request.
The tracking endpoint should validate the click, but the final redirect destination must come from trusted or cryptographically protected data.
A global advertising platform may receive clicks from users in many regions. Sending every click to one distant region would increase redirect latency.
A better design uses regional ingestion:
User
 ↓
Nearest Region
 ↓
Regional Click Service
 ↓
Regional Durable Stream
Each region can process clicks locally and produce partial aggregates.
US      → ad_123 = 500
India   → ad_123 = 300
Europe  → ad_123 = 200
                 ↓
          Global Aggregation
                 ↓
             1,000
This keeps the latency-sensitive click path regional instead of synchronously sending every raw click across regions.
Raw events can later be replicated or archived according to durability, disaster recovery, and regulatory requirements.
If a region loses connectivity to the global analytics system but its local durable infrastructure remains healthy, it can continue accepting clicks.
Regional Clicks
      ↓
Regional Durable Stream
      ↓
Buffer Events
      ↓
Connectivity Returns
      ↓
Catch Up
During the outage, global dashboards may temporarily show incomplete results.
The Metrics Service should expose freshness or completeness information rather than presenting incomplete global metrics as final.
Click event schemas will change as the system evolves, so producers and consumers need a safe way to handle different versions.
An early event may contain:
{
  "ad_id": "...",
  "timestamp": "..."
}
A later version may add new fields:
{
  "ad_id": "...",
  "campaign_id": "...",
  "placement_id": "...",
  "timestamp": "..."
}
Each event should include a schema_version, and consumers should remain backward compatible where practical.
Data-quality checks are also needed because healthy servers do not necessarily mean correct analytics.
Useful invariants include:
unique_processed_events <= accepted_unique_events

deduplicated_clicks <= raw_clicks

valid_clicks <= deduplicated_clicks

billable_clicks <= valid_clicks
Using unique or deduplicated counts is important because at-least-once delivery can cause the same event to be processed more than once.
The platform should also compare counts across different processing paths:
Stream Aggregates
       vs
Archived Events
       vs
Recomputed Aggregates
Unexpected differences can indicate event loss, duplicate processing, pipeline bugs, or incorrect aggregation logic.
For an analytics system, monitoring data correctness is just as important as monitoring infrastructure health.
Failures should affect the smallest possible part of the system, while durable events allow asynchronous components to recover later.
Failure | Expected Behavior |
|---|---|
Stream processor crashes | Restore checkpoint/state and replay required events |
Analytics DB slows down | Allow stream lag to grow temporarily and catch up later |
Event is delivered twice | Process idempotently or deduplicate |
Streaming aggregate is incorrect | Recompute from the raw event archive |
Viral ad creates a hot partition | Shard the hot key and combine partial aggregates |
Dedup store fails | Apply an explicit fail-open or fail-closed policy |
Query store fails | Continue click ingestion; dashboards may become stale or unavailable |
Regional analytics link fails | Buffer events regionally and catch up after recovery |
The main principle is to keep click ingestion independent from downstream analytics failures whenever the durable stream remains available.
If request-level deduplication becomes unavailable, the system needs an explicit policy.
Policy | Behavior | Trade-Off |
|---|---|---|
Fail closed | Reject clicks when deduplication cannot be verified | Reduces duplicate risk but may lose legitimate clicks |
Fail open | Accept and durably capture clicks | Preserves events but may temporarily overcount |
For many analytics workloads, fail-open can be reasonable because duplicate events can later be identified and corrected through idempotent processing and reconciliation.
Billing or contractual systems may require stricter behavior, so the choice depends on business requirements.
Prefer recoverable errors over silent data loss. Preserve durable click events whenever the business correctness model allows it.
Monitoring should cover the complete system: the latency-sensitive click path, streaming pipeline, analytics layer, and data correctness.
Click path
Click endpoint latency.
Redirect latency.
Accepted and rejected clicks per second.
Signature validation failures.
Deduplication rate.
Streaming pipeline
Events processed per second.
Consumer and partition lag.
Oldest unprocessed event age.
Processor throughput.
Late-event rate.
Checkpoint failures.
Hot partitions.
Analytics
Event-to-query latency.
Query p50, p95, and p99 latency.
Analytics DB write latency.
Analytics DB query latency.
Aggregate correction rate.
Data quality
Raw event count.
Streaming aggregate count.
Recomputed aggregate count.
Reconciliation differences.
Monitoring these layers together helps distinguish an infrastructure problem from a data-correctness problem.
Calling a dashboard “real time” is vague. A more useful metric is how long an accepted click takes to become visible in queryable metrics.
For example:
Click Accepted:
10:15:02

Visible in Dashboard:
10:15:08

Event-to-Query Latency:
6 seconds
This can be expressed as a measurable SLO:
99% of accepted clicks should be reflected
in queryable dashboard aggregates within X seconds.
The value of X depends on the product's freshness requirement.
Event-to-query latency measures the freshness advertisers actually experience, while consumer lag mainly measures the health of the processing pipeline.
The complete flow connects impression creation, click tracking, durable event capture, real-time aggregation, querying, and reconciliation.
Create Impression
      ↓
Generate Impression ID
      ↓
Sign Tracking Metadata
      ↓
User Sees Ad
      ↓
User Clicks
      ↓
Click Service
      ↓
Validate Token
      ↓
Durably Publish Click
      ↓
Redirect User
      ↓
Durable Event Stream
      ↓
Partition Event
      ↓
Stream Processor
      ↓
Event-Time Window
      ↓
Update Aggregate
      ↓
Analytics DB
      ↓
Metrics Service
      ↓
Advertiser Dashboard

Durable Event Stream
      ↓
Raw Event Archive
      ↓
Batch Reprocessing
      ↓
Reconciliation
      ↓
Correct Analytics DB
The synchronous user-facing path remains intentionally small:
Click
  ↓
Validate
  ↓
Durably Publish
  ↓
Redirect
Everything after durable event capture can happen asynchronously.
The click path is optimized for low latency and durability, while the asynchronous pipeline handles aggregation, analytics, recovery, and reconciliation.
At the HLD level, focus on the major distributed components and how click events move through the system.
                         AD SYSTEM
                            |
                    Signed Impression
                            |
                            v
                          USER
                            |
                          CLICK
                            |
                            v
                    +---------------+
                    | CLICK SERVICE |
                    +---------------+
                      |           |
                      |           +------→ 302 Redirect
                      |                       |
                      v                       v
               DURABLE EVENT STREAM      Advertiser Site
                      |
          +-----------+------------+
          |                        |
          v                        v
   STREAM PROCESSOR          RAW EVENT ARCHIVE
          |                        |
          v                        v
 REAL-TIME AGGREGATES          DATA LAKE
          |                        |
          v                        v
   ANALYTICS STORE          BATCH PROCESSOR
          ^                        |
          |                        v
          +---------------- RECONCILIATION
          |
          v
   METRICS SERVICE
          |
          v
ADVERTISER DASHBOARD
The Click Service keeps the synchronous path small by validating the tracking request, durably publishing the event, and redirecting the user. Everything else happens asynchronously.
Supporting components may include:
Dedup Store
Token Verification
Schema Registry
Hot-Key Detection
Monitoring
Fraud Pipeline
Regional Aggregation
The most useful HLD deep dives are stream partitioning, window aggregation, event time, idempotency, hot partitions, reconciliation, and failure recovery.
At the LLD level, focus on event identity, aggregation state, and the rules that keep processing correct and recoverable.
ClickEvent represents one accepted click moving through the event-processing pipeline.
ClickEvent
----------
eventId
adId
campaignId
advertiserId
impressionId
eventTime
schemaVersion
MetricBucket represents the aggregated click count for an ad within a time window.
MetricBucket
------------
adId
windowStart
windowEnd
clickCount
updatedAt
ImpressionToken contains the signed information required to validate an ad impression when the click arrives.
ImpressionToken
---------------
impressionId
adId
expiresAt
signature
The most important LLD rules are:
Accepted clicks should not disappear silently.
Duplicate delivery should not incorrectly increase final metrics.
Event-time windows should support the configured late-arrival policy.
Stream-processing state should be recoverable after failures.
Advertiser authorization must be enforced on every metrics query.
Raw events must remain available for the required recovery period.
Aggregate corrections should be safe to apply repeatedly.
Redirect destinations must come from trusted or cryptographically protected data.
These processing invariants are more important than creating a large class hierarchy.
Batch and stream processing are both useful in an Ad Click Aggregator, but they solve different problems.
Area | Batch Processing | Stream Processing |
|---|---|---|
Latency | Higher | Low |
Processing model | Periodic | Continuous |
Reprocessing | Usually simpler | More complex |
Late events | Included in later recomputation | Requires explicit handling |
State recovery | Usually simpler | Checkpoints and replay may be required |
Best use | Historical recomputation and reconciliation | Near-real-time analytics |
For this system, stream processing is the primary path because advertisers need fresh dashboard metrics.
Batch processing complements it by rebuilding historical aggregates, correcting errors, and supporting reconciliation.
Use streaming for freshness and batch processing for recomputation and correction.
A practical Ad Click Aggregator can evolve gradually. Each stage solves a new scale, latency, or correctness problem.
At small scale, the Click Service can store click events directly in a database.
Click Service
     ↓
Click DB
Dashboard queries can calculate metrics directly from these stored events. This is simple, but becomes expensive as click volume grows.
As raw-event queries become expensive, periodic jobs can precompute common metrics.
Click DB
   ↓
Batch Job
   ↓
Aggregate DB
   ↓
Dashboard
This makes dashboard queries faster, but metrics are updated only when the next batch finishes.
When click volume and freshness requirements increase, introduce a durable event stream.
Click Service
     ↓
Durable Event Stream
     ↓
Stream Processor
This decouples the latency-sensitive click path from downstream analytics processing and provides buffering and replay.
When advertisers need fresh dashboard metrics, add continuous stream processing.
Event Stream
     ↓
Window Aggregation
     ↓
Analytics DB
     ↓
Dashboard
This stage introduces event-time processing, late-event handling, time windows, and fast analytical storage.
As metrics become more important for reporting and business decisions, add stronger correctness mechanisms:
Stable event and impression IDs.
Signed impression tokens.
Idempotent processing and deduplication.
Raw event archival.
Replay and reconciliation.
These mechanisms help the system recover from duplicate delivery, processing failures, and incorrect aggregates.
At very large scale, additional techniques are needed to handle uneven traffic and global workloads:
Hot-key sharding.
Multi-region ingestion.
Multi-stage aggregation.
Tenant isolation.
Historical rollups.
The architecture therefore evolves roughly as:
Simple Database
      ↓
Batch Aggregation
      ↓
Durable Streaming
      ↓
Real-Time Analytics
      ↓
Stronger Correctness
      ↓
Massive-Scale Architecture
Add complexity when traffic, freshness, correctness, or availability requirements justify it rather than starting with every advanced component.
There is no single best architecture for every Ad Click Aggregator. The right choice depends on traffic, freshness, accuracy, cost, and business requirements.
Decision | Simpler Choice | More Scalable Choice | Main Trade-Off |
|---|---|---|---|
Dashboard queries | Query raw events | Pre-aggregate metrics | Flexibility vs query speed |
Processing | Batch | Streaming | Simplicity vs freshness |
Unique counting | Exact counting | Approximate structures such as HLL | Accuracy vs memory |
Ad partitioning | Partition by | Shard hot keys | Simplicity vs hot-key scalability |
Metric correctness | Streaming results | Streaming + reconciliation | Freshness vs recoverability |
Dedup failure | Fail closed | Fail open + later repair | Duplicate risk vs event-loss risk |
Storage granularity | Minute-level only | Minute/hour/day rollups | Storage and processing cost vs query speed |
These choices should follow the actual product requirements rather than adding complexity by default.
Common mistakes include:
Doing aggregation or fraud detection in the redirect path.
Querying raw click events instead of using pre-aggregated metrics.
Ignoring event time, late events, and out-of-order delivery.
Assuming the event stream automatically prevents duplicates or provides end-to-end exactly-once processing.
Using the wrong deduplication key instead of impression identity.
Ignoring hot ads when partitioning by ad_id.
Deleting raw events without a replay and reconciliation path.
Pre-aggregating too many dimensions and causing cardinality explosion.
Allowing analytics failures to block click ingestion.
At scale, an Ad Click Aggregator is a distributed streaming and analytics system, not just a click counter.
It collects individual advertisement click events and converts them into aggregated metrics that advertisers can query efficiently.
Click ingestion can reach thousands or millions of events per second, while advertiser dashboard queries are much less frequent.
Repeatedly scanning huge raw datasets creates unnecessary computation and high latency. Pre-aggregated metrics make common queries much faster.
It buffers traffic, preserves events, supports replay, separates ingestion from processing, and lets consumers scale independently.
ad_id is a useful starting key because events for the same ad stay together. Very hot ads may require salted sub-shards.
Group events by a key such as ad_id, assign them to a time window, and continuously update the count.
It is the time when the click actually happened rather than when the processor received it.
They help the processor handle out-of-order events and decide when an event-time window is sufficiently complete.
Use stable event or impression identities, atomic deduplication where appropriate, and idempotent downstream processing.
(user_id, ad_id) enough?The same user can legitimately click the same ad after seeing it in different impressions.
It prevents clients from freely inventing apparently valid unique impressions.
Shard the hot ad across multiple sub-keys, compute partial aggregates, and combine them in another aggregation stage.
Events remain in the durable stream. A replacement processor restores its checkpoint or offset and replays unprocessed events.
Capture events durably, retain them for replay, archive raw events, use recoverable processing state, and reconcile aggregates.
They support reprocessing after bugs, historical analysis, debugging, and reconstruction of incorrect aggregates.
It recomputes metrics from durable raw data and compares or corrects the real-time aggregates.
Advertiser queries are analytical and commonly involve time ranges, filtering, and aggregation over large datasets.
Maintain hourly and daily rollups instead of reading minute-level data for very large ranges.
Use scalable exact state when exactness is required, or structures such as HyperLogLog when approximate counts are acceptable.
If impression events are available, CTR is clicks divided by impressions for the same reporting dimensions and period.
Click ingestion continues through the durable stream. Processing can lag and catch up when the database recovers.
The system follows its chosen fail-open or fail-closed policy. For some analytics workloads, accepting possible duplicates and repairing them later is preferable to losing legitimate events.
Use the durable stream as a buffer, scale processors horizontally, batch analytical writes, and monitor consumer lag.
Use regional click ingestion and streams, then merge regional aggregates into global metrics.
Redirect latency, accepted event rate, consumer lag, oldest event age, event-to-query latency, late events, hot partitions, analytics latency, deduplication rate, and reconciliation differences.
                         AD SYSTEM
                            |
                    Signed Impression
                            |
                            v
                          USER
                            |
                          CLICK
                            |
                            v
                    +---------------+
                    | CLICK SERVICE |
                    +---------------+
                      |           |
                      |           +------→ Redirect
                      |                       |
                      v                       v
               DURABLE EVENT STREAM      Advertiser Site
                      |
          +-----------+------------+
          |                        |
          v                        v
   STREAM PROCESSOR          RAW EVENT ARCHIVE
          |                        |
          |                        v
          |                   DATA LAKE
          |                        |
          v                        v
   REAL-TIME AGGREGATES      BATCH PROCESSOR
          |                        |
          +------------+-----------+
                       |
                       v
                 ANALYTICS STORE
                       |
                       v
                 METRICS SERVICE
                       |
                       v
              ADVERTISER DASHBOARD
Supporting capabilities include:
Impression IDs
Signed Tokens
Deduplication
Event-Time Windows
Watermarks
Hot-Key Sharding
Rollup Tables
Checkpointing
Reconciliation
Monitoring
Fraud Detection
Regional Aggregation
The central design principle is:
Capture clicks durably, keep the redirect path small, aggregate events continuously for fast dashboards, and preserve raw events so incorrect results can be reconstructed and reconciled.
This principle explains most of the major architecture decisions in an Ad Click Aggregator.
