
Durgesh Tiwari
Author
Modern applications run on multiple servers, databases, APIs, and microservices. Since many services work together, finding the cause of a problem is not always easy.
When something goes wrong, developers need more than just an error message. They need to know what happened, where it happened, and why it happened so they can fix the issue quickly.
This is where Observability becomes important.
Observability helps developers understand the internal state of an application by collecting and analyzing logs, metrics, and traces. It makes troubleshooting easier, reduces downtime, and improves application reliability.
In simple words, Observability helps you understand what is happening inside an application so you can find and fix problems quickly.
Observability is widely used in cloud applications, microservices, and distributed systems, where multiple services work together to process user requests.
Observability is the ability to understand the health and behavior of an application by collecting data from different parts of the system.
Instead of checking the application code directly, developers use logs, metrics, and traces to understand what is happening inside the application.
This makes it easier to detect issues, identify their root cause, and fix them before they affect more users.
In simple words, Observability helps developers understand how an application is working without directly looking at its code.
                    Observability
                      │
      ┌───────────────┼───────────────┐
      │               │               │
      ▼               ▼               ▼
    Logs           Metrics         Traces
      │               │               │
What happened? How healthy? Request FlowImagine an online shopping application where customers report that the website has become slow.
Using observability tools, developers can:
Check logs to find application errors.
Monitor metrics such as CPU, memory, and response time.
Analyze traces to identify which service is causing the delay.
By combining this information, developers can quickly locate the problem and restore the application's performance.
As applications grow, they become more complex. A single user request may pass through several services before returning a response.
If one service becomes slow or fails, developers need a fast way to identify the problem.
Observability helps by:
Detecting problems quickly.
Finding the root cause of failures.
Monitoring application health.
Reducing downtime.
Improving application performance.
Providing a better user experience.
In a distributed system, multiple services handle thousands of requests every second. When an error occurs or a user reports a problem, developers need a way to understand what happened inside the application.
Logging is the process of recording important events that occur during an application's execution. These records are called logs.
Logs contain information such as application events, errors, warnings, and user activities, making it easier to monitor and troubleshoot the system.
In simple words, logs are records that tell you what happened inside an application.
Imagine a customer logging into an online shopping application.
A log entry may record:
Login time
User ID
IP address
Login status
If the login fails, developers can check the logs to identify the reason, such as an incorrect password, authentication failure, or a server error.
Logging provides several advantages:
Helps Debug Errors – Makes it easier to identify and fix application issues.
Records Application Events – Maintains a history of important system activities.
Simplifies Troubleshooting – Helps developers quickly locate the source of problems.
Analyzes System Behavior – Provides insights into how the application is performing.
Supports Security Audits – Records user activities and security-related events.
In a distributed system, applications run on multiple servers, databases, APIs, and services. To ensure that everything is working correctly, developers continuously track the health and performance of these components.
Monitoring is the process of continuously observing an application's health, performance, and availability. It helps detect problems early so they can be fixed before they affect users.
In simple words, Monitoring tells you whether your application is healthy and running properly.
Imagine an online shopping application.
A monitoring system continuously checks:
CPU usage
Memory usage
Disk space
Server availability
API response time
If CPU usage becomes unusually high or a server stops responding, the monitoring system automatically generates an alert so developers can investigate the issue.
Monitoring provides several advantages:
Detects Issues Early – Identifies problems before they impact users.
Reduces Downtime – Helps resolve issues quickly.
Improves System Reliability – Ensures services remain available.
Maintains Application Performance – Continuously tracks system health and resource usage.
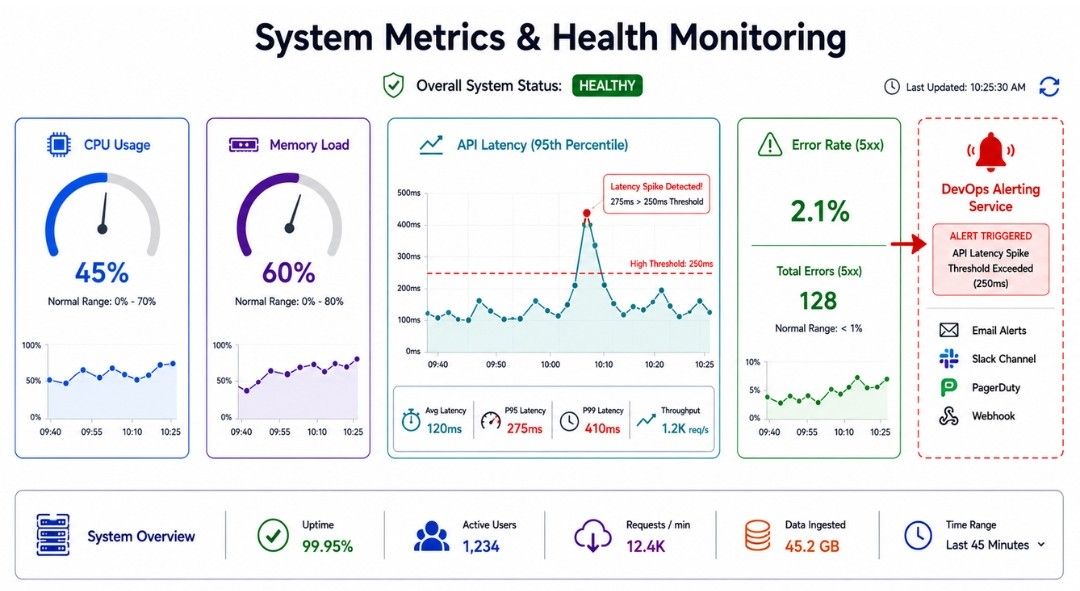
In a distributed system, developers need a quick way to measure how well an application is performing. Instead of reading thousands of log entries, they use numerical measurements that show the health and performance of the system.
Metrics are numerical values that measure the performance, health, and resource usage of an application over time.
Unlike logs, metrics are lightweight, easy to collect, and can be displayed on dashboards and graphs for continuous monitoring.
In simple words, Metrics are numbers that show how well an application is performing.
Some commonly monitored metrics include:
CPU usage
Memory usage
Disk usage
Network traffic
Request count
Response time
Error rate
Imagine an online shopping application that provides product search through an API.
Normally, the API responds in 200 milliseconds.
If the response time suddenly increases to 2 seconds, the response time metric immediately shows the performance issue, helping developers investigate the cause before many users are affected.
Metrics provide several advantages:
Easy to Monitor System Health – Gives a quick overview of application performance.
Supports Dashboards and Charts – Makes performance trends easy to visualize.
Helps Identify Performance Issues – Detects unusual changes in system behavior.
Useful for Capacity Planning – Helps estimate future resource requirements.
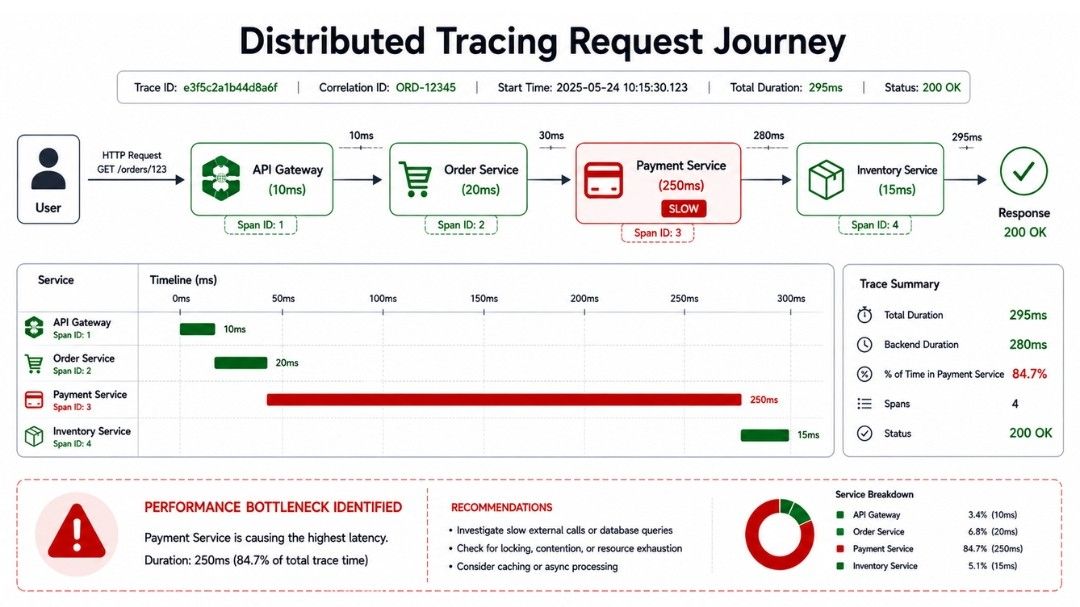
In a distributed system, a single user request often passes through multiple services before a response is returned. If the request becomes slow or fails, it can be difficult to identify which service is responsible.
Distributed Tracing tracks the complete journey of a request as it moves across different services. It records how much time each service takes and helps developers identify delays or failures.
In simple words, Distributed Tracing follows a request from start to finish across all services.
Imagine a customer placing an order in an online shopping application.
The request passes through:
API Gateway
Order Service
Payment Service
Inventory Service
Notification Service
Distributed Tracing records the path of the request and shows how much time each service spends processing it.
If the Payment Service takes much longer than the others, developers can quickly identify it as the source of the delay.
User Request
      │
      ▼
API Gateway (10 ms)
      │
      ▼
Order Service (20 ms)
      │
      ▼
Payment Service (250 ms)  ← Slow
      │
      ▼
Inventory Service (15 ms)
      │
      ▼
Notification Service (8 ms)
      │
      ▼
ResponseDistributed Tracing provides several advantages:
Finds Slow Services – Identifies services causing delays.
Helps Locate Bottlenecks – Shows where request processing slows down.
Simplifies Debugging – Makes it easier to trace failures across multiple services.
Improves Application Performance – Helps optimize request processing.
Shows the Complete Request Flow – Provides end-to-end visibility of user requests.
In a distributed system, a single user request often passes through multiple services. Each service generates its own logs, making it difficult to identify which log entries belong to the same request.
A Correlation ID is a unique identifier that is attached to a request when it enters the system. The same Correlation ID travels with the request across all services and is included in every log entry.
In simple words, a Correlation ID helps track a single request across multiple services.
Imagine a customer placing an order in an online shopping application.
The request passes through:
API Gateway
Order Service
Payment Service
Inventory Service
Notification Service
Each service records logs using the same Correlation ID.
If the request fails, developers can search for that Correlation ID and view the complete request history across all services.
          Correlation ID: ORD-12345
                    │
                    ▼
User Request
      │
      ▼
API Gateway
(Log + ORD-12345)
      │
      ▼
Order Service
(Log + ORD-12345)
      │
      ▼
Payment Service
(Log + ORD-12345)
      │
      ▼
Inventory Service
(Log + ORD-12345)
      │
      ▼
Notification Service
(Log + ORD-12345)Correlation IDs provide several advantages:
Simplifies Troubleshooting – Helps locate issues quickly.
Connects Logs Across Services – Links related log entries from different services.
Speeds Up Debugging – Makes it easier to trace failures.
Improves Request Tracking – Provides end-to-end visibility of a request.

Observability is built on three core components: Logs, Metrics, and Traces. Together, they provide a complete view of an application's health and behavior.
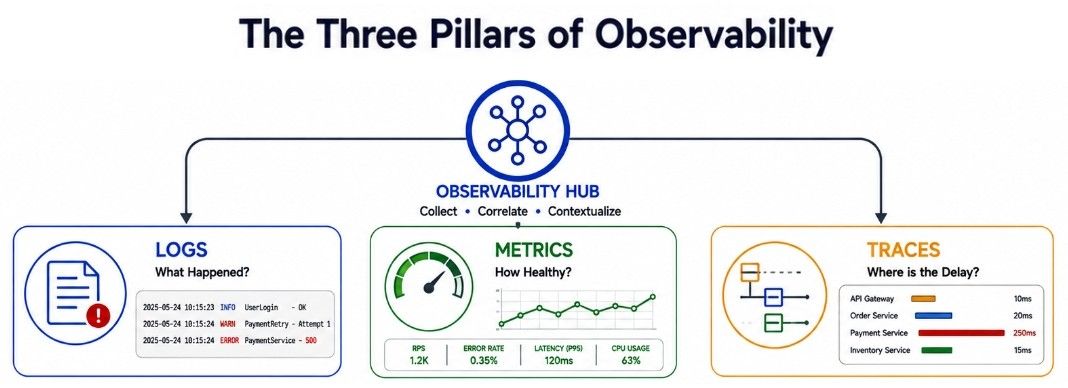
Each pillar answers a different type of question. By combining all three, developers can quickly detect problems, understand their impact, and identify the root cause.
Logs record detailed information about events that occur inside an application.
They help answer questions such as:
What happened?
When did it happen?
Why did it happen?
Logs are mainly used for debugging errors and understanding application behavior.
Metrics provide numerical measurements about an application's performance and health.
They help answer questions such as:
Is the system healthy?
How is performance changing over time?
Metrics are mainly used for monitoring, dashboards, and performance analysis.
Traces show how a request travels through multiple services in a distributed system.
They help answer questions such as:
Which services processed the request?
Where is the delay occurring?
Traces are mainly used for identifying bottlenecks and debugging distributed applications.
Each pillar provides different information:
Logs explain what happened.
Metrics show how the system is performing.
Traces reveal how a request moves through the system.
Together, they give developers complete visibility into an application's behavior, making it easier to detect, diagnose, and resolve issues.
Consider an online shopping platform where customers report that the checkout process has become slow.
The operations team first checks the monitoring dashboard, which shows that the application's response time has increased.
Next, they use distributed tracing to follow the customer's request across different services. The trace reveals that most of the delay is occurring in the Payment Service.
To investigate further, the developers search the application logs using the same Correlation ID associated with the request. The logs show that the payment database is experiencing timeout errors.
By combining metrics (response time), traces (request flow), logs (error details), and Correlation IDs (request tracking), the team quickly identifies the root cause and resolves the issue without affecting other services.
Customer Reports Slow Checkout
              │
              ▼
Monitoring Dashboard
(Response Time High)
              │
              ▼
Distributed Tracing
(Payment Service Slow)
              │
              ▼
Search Logs
using Correlation ID
              │
              ▼
Database Timeout Found
              │
              ▼
Issue FixedObservability helps developers understand the health and behavior of distributed applications. It combines Logs, Metrics, and Distributed Tracing—the Three Pillars of Observability—to provide complete visibility into an application's behavior.
Logging records application events, Metrics measure system performance and health, and Distributed Tracing follows requests across multiple services. Monitoring continuously tracks system health and generates alerts, while Correlation IDs connect logs across services to trace a single request.
Together, these concepts make it easier to detect issues, identify root causes, troubleshoot problems, and build reliable, high-performance distributed applications.
