Clean • Professional
Modern Spring Boot applications, especially microservices, operate in distributed and dynamic environments where uptime alone is not enough. Teams must understand system behavior, performance bottlenecks, and failure causes.
The Spring Boot Observability Stack provides this visibility by combining metrics, traces, and logs. With native integrations to industry-standard tools, Spring Boot makes it easier to monitor, debug, and operate applications reliably in production.
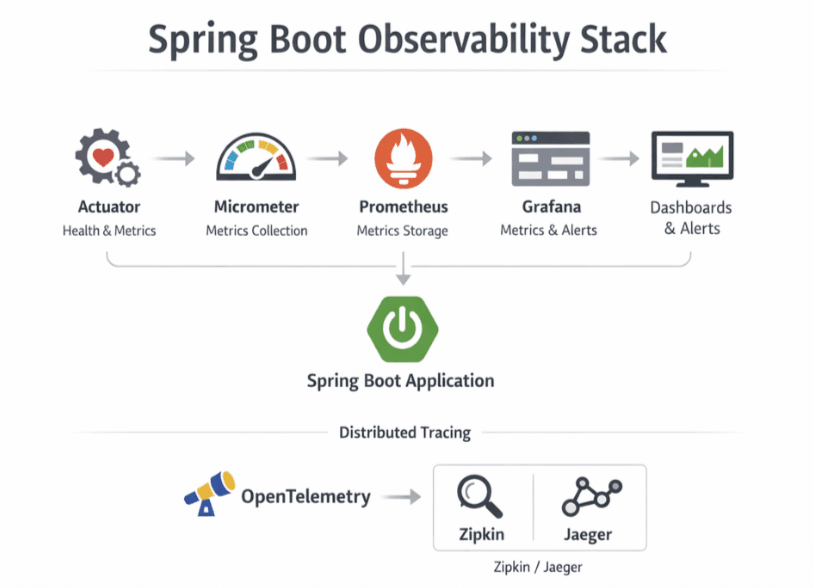
Spring Boot observability follows a layered and unified approach, where each tool has a clear responsibility:
Spring Boot Actuator → Micrometer → Prometheus → Grafana
+ Distributed Tracing via OpenTelemetry, Zipkin, and Jaeger

Together, these tools provide:
Spring Boot Actuator acts as the entry point for observability.
It exposes production-ready endpoints that provide insights into:
Actuator allows monitoring systems to inspect the internal state of a running application without writing custom code.
In production, Actuator endpoints are commonly used by:
Actuator ensures your application is observable by design, not as an afterthought.
Micrometer is the metrics backbone of Spring Boot observability.
It provides a vendor-neutral API, allowing teams to collect metrics once and export them to systems like Prometheus, Datadog, or CloudWatch.
Micrometer automatically collects a rich set of metrics that give deep insight into application and system behavior.
These metrics help monitor application memory and runtime performance:
JVM metrics are essential for detecting memory leaks, GC pressure, and thread exhaustion.
HTTP metrics focus on user-facing performance and reliability:
These metrics help identify slow endpoints, traffic spikes, and failing APIs.
Resource-level metrics provide visibility into infrastructure health:
They are critical for understanding scalability limits, resource saturation, and capacity risks.
Technical metrics alone do not reflect real business health.
Micrometer allows teams to define custom business metrics, such as:
Why Business Metrics Matter
Business metrics help answer critical questions like:
By combining business metrics with system metrics, teams gain true production visibility.
Prometheus is a time-series monitoring system designed for cloud-native environments.
It uses a pull-based model, periodically scraping metrics from Spring Boot applications via Actuator endpoints.
Why Prometheus Works Well with Spring Boot
Prometheus becomes the single source of truth for metrics data.
Grafana transforms raw metrics into actionable insights.
It connects to Prometheus and visualizes data using:
What Professional Grafana Dashboards Provide
Grafana enables teams to monitor production systems at a glance and respond quickly to anomalies.
In microservices architectures, a single request may pass through multiple services.
Distributed tracing helps answer one critical question:
“Where did the request slow down or fail?”
OpenTelemetry is the industry-standard framework for observability instrumentation.
It provides:
Spring Boot integrates seamlessly with OpenTelemetry, making it the recommended tracing solution.
Zipkin and Jaeger visualize end-to-end request execution across microservices.
They help teams see:
These tools make it easy to identify performance bottlenecks within seconds.
One of the most powerful benefits of observability is event correlation.
By using Trace IDs and Span IDs, Spring Boot can:
This approach makes debugging faster, more accurate, and far less stressful, especially during high-pressure production incidents.
All observability components integrate seamlessly to provide a single, end-to-end view of application health, performance, and behavior.
Unified Observability Flow
This flow shows how Spring Boot collects, standardizes, stores, and visualizes metrics and traces across distributed systems for complete visibility.
Spring Boot Application
   → Actuator (Expose health & metrics)
   → Micrometer (Standardize metrics)
   → Prometheus (Store metrics)
   → Grafana (Visualize & alert)

Spring Boot Application
   → OpenTelemetry
→ Zipkin / Jaeger (Distributed tracing)A well-designed observability stack enables teams to:
Observability turns production issues from guesswork into clear insights.
The Spring Boot Observability Stack combines powerful tools and proven best practices to deliver production-grade visibility.
By using:
teams can confidently operate scalable, resilient, and high-performing microservices in real-world production environments.