Clean • Professional
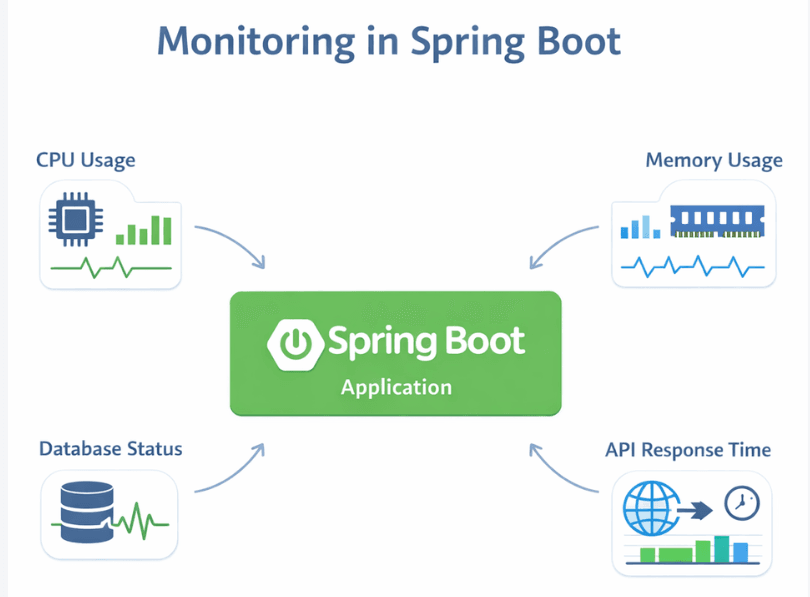
Monitoring is a core foundation of running Spring Boot applications in production. It focuses on real-time health tracking, performance visibility, and alert management, helping teams detect known failures early and maintain system reliability under real-world traffic.
In modern systems, effective monitoring ensures uptime, stability, and predictable behavior.
Monitoring is the practice of tracking system health, performance, and availability in real time.
It answers known and critical questions, such as:

Monitoring is primarily reactive. It is designed to detect known failures, trigger alerts, and help teams respond quickly to incidents.
Monitoring focuses on “What is broken?”, while observability focuses on “Why is it broken?”
Spring Boot Actuator provides production-ready monitoring features with minimal configuration.
It exposes endpoints that give insight into application health, metrics, and runtime information.
Actuator Dependency
<dependency>
	<groupId>org.springframework.boot</groupId>
	<artifactId>spring-boot-starter-actuator</artifactId>
</dependency>
Once enabled, Actuator becomes the core monitoring layer of a Spring Boot application.
/actuator/health
UP, DOWN, OUT_OF_SERVICE)/actuator/metrics
/actuator/info
These endpoints provide real-time visibility into application state.
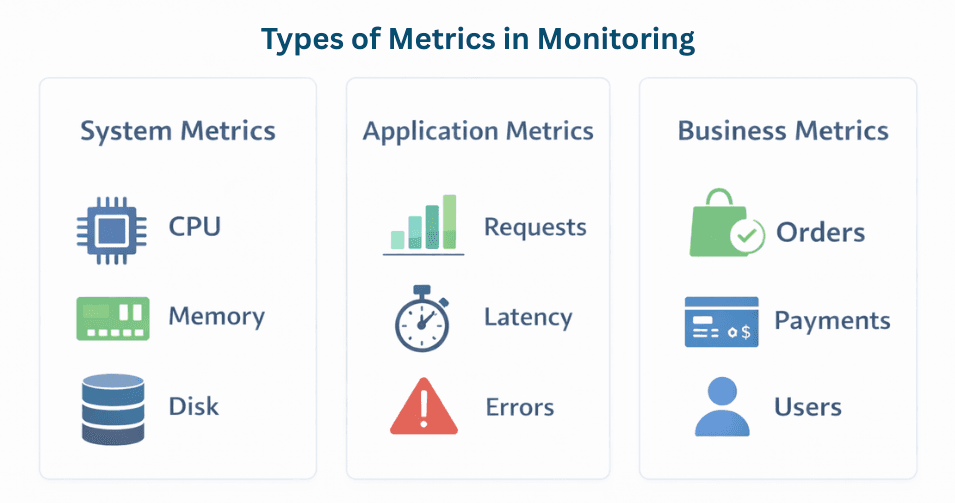
Metrics are numerical measurements collected over time and form the backbone of monitoring.

These metrics reflect the health of the underlying infrastructure.
These metrics help identify resource exhaustion and infrastructure-level issues early.
These metrics focus on how your Spring Boot application behaves.
They reveal performance bottlenecks and user-impacting problems.
Business metrics connect monitoring to real business outcomes:
These metrics help teams understand how technical health affects business performance.
Health checks indicate whether the application and its dependencies are functioning correctly.
Spring Boot provides built-in indicators for:
These checks ensure the application is not just running, but running correctly.
Real-world systems often need business-specific health checks, such as:
Custom health indicators ensure monitoring reflects actual production readiness, not just uptime.
Logs play a key role in monitoring and production debugging.
ELK is ideal for centralized, searchable, structured logging.
Loki is efficient and well-suited for cloud-native Spring Boot environments.
Monitoring is incomplete without effective alerts.
Common Alert Conditions
Alert Integrations
Alerts can be delivered via:
Well-defined alerts ensure fast incident response without alert fatigue.
To build an effective monitoring strategy:
👉 Good monitoring leads to faster incident response and higher system reliability.
Effective monitoring enables:
Monitoring in Spring Boot is essential for maintaining stable, high-performance applications.
By using:
teams can maintain stable, high-performing systems and respond confidently to production issues.