
Durgesh Tiwari
Author
Exception tracing and stack analysis are important debugging techniques used to identify, understand, and fix runtime errors in Java applications.
When an exception occurs, Java generates a stack trace that shows where the error happened and how the program reached that point.
In simple words: A stack trace is like an “error roadmap” that helps developers find the exact location of a problem in the code.
Exception tracing is the process of analyzing exceptions and their stack traces to understand the root cause of an error.
It helps developers:
Find runtime errors quickly
Track method execution flow
Identify incorrect program logic
Debug complex applications efficiently
Understand exception propagation
public class Test {

    static void method1() {
        method2();
    }

    static void method2() {
        int result = 10 / 0;
    }

    public static void main(String[] args) {
        method1();
    }
}A stack trace is a detailed error report generated when an exception occurs during program execution.
It contains:
Exception type
Error message
Method call sequence
File names and line numbers
public class Test {

    public static void main(String[] args) {

        int result = divide(10, 0);

        System.out.println(result);
    }

    static int divide(int a, int b) {
        return a / b;
    }
}
Output
Exception in thread "main"
java.lang.ArithmeticException: / by zero
    at Test.divide(Test.java:11)
    at Test.main(Test.java:5)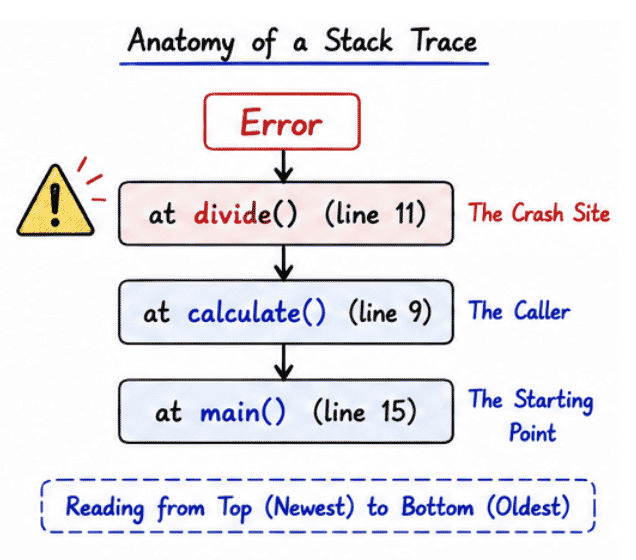
A stack trace contains several important parts that help developers identify and analyze errors in Java applications.
The exception type shows the category of error that occurred during program execution.
It helps developers understand what kind of problem caused the program to fail.
Example
java.lang.ArithmeticException👉 Here, ArithmeticException occurred because the program attempted division by zero.
The error message explains the exact reason why the exception occurred.
It provides more details about the problem in the program.
Example
/ by zero👉 Here, the program attempted to divide a number by zero, which caused the exception.
Stack frames show the exact location in the code where the exception occurred.
Each stack frame contains information about the method call involved in the error.
Example
at Test.divide(Test.java:11)This line contains:
Class Name → Test
Method Name → divide()
File Name → Test.java
Line Number → 11
👉 Stack frames help developers identify the exact line responsible for the error.
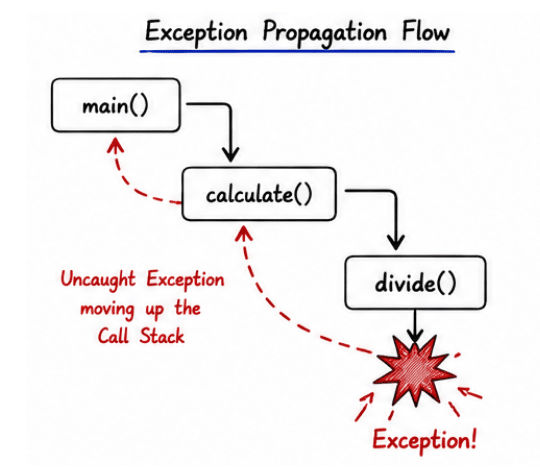
When an exception occurs in a method and is not handled there, it automatically moves to the calling method.
This movement of exceptions through the method call stack is called exception propagation.
Flow Example
main()
   ↓
calculate()
   ↓
divide()
   ↓
Exception Occurs
   ↓
Stack Trace Generated
👉 If a method does not handle an exception, Java propagates it to the caller method.
public class Test {

    static void divide() {
        int x = 10 / 0;
    }

    static void calculate() {
        divide();
    }

    public static void main(String[] args) {

        calculate();
    }
}
Output
Exception in thread "main"
java.lang.ArithmeticException: / by zero
    at Test.divide(Test.java:5)
    at Test.calculate(Test.java:9)
    at Test.main(Test.java:15)
👉 The stack trace clearly shows how the exception traveled through different method calls before terminating the program.
Java maintains a call stack while methods are executing in a program. When an exception occurs, the JVM analyzes this call stack and generates a stack trace.
Stack Analysis Process
JVM stops normal program execution
Stack trace is generated automatically
Method calls are listed from latest to oldest
Developers analyze the trace to identify the root cause of the error
Reading stack traces properly is one of the most important debugging skills in Java.
A stack trace helps developers identify where an exception occurred and how the program reached that point.
The topmost application-level stack frame usually shows the exact location where the error occurred.
Example
at Test.divide(Test.java:11)👉 This indicates that the exception occurred inside the divide() method at line 11 of Test.java.
While reading a stack trace, focus first on your own application classes and methods instead of internal Java library calls.
Application-level stack frames usually contain the actual source of the problem.
Example:
at com.myapp.service.UserService.login(UserService.java:45)👉 This line is more important because it points to your application code where the error likely occurred.
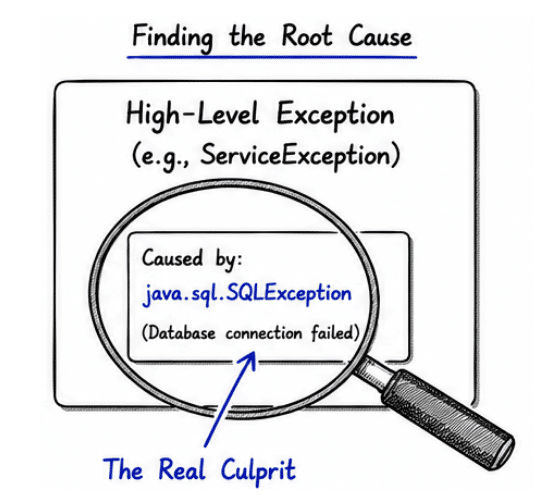
Sometimes one exception may trigger another exception internally.
In such cases, the stack trace contains a root cause section that reveals the actual problem.
Look for:
Caused by:Example
Caused by: java.sql.SQLException: Database connection failed👉 This often points to the real source of the error hidden behind higher-level exceptions.
Root cause analysis means identifying the original reason behind an exception instead of fixing only the visible symptom.
In many cases, one exception is caused by another lower-level exception. The actual issue is called the root cause.
Example
java.sql.SQLException
Caused by: java.net.ConnectException
👉 Here, the actual root cause is a database connection failure.
Prevents repeated issues
Helps fix the actual problem
Improves application stability
Reduces debugging time
Makes troubleshooting more effective
Java stack traces often contain common runtime exceptions that help developers identify specific types of errors.
Exception | Cause |
|---|---|
| Accessing a null object reference |
| Division by zero or invalid arithmetic operation |
| Accessing an invalid array index |
| Invalid string-to-number conversion |
| Invalid type casting between objects |
NullPointerException occurs when a program tries to access a method or property using a null object reference.
public class Test {

    public static void main(String[] args) {

        String name = null;

        System.out.println(name.length());
    }
}
Output
Exception in thread "main"
java.lang.NullPointerException
    at Test.main(Test.java:7)
👉 The stack trace clearly identifies the exact line where the error occurred, making debugging easier.
Java provides the printStackTrace() method to display detailed exception information and stack traces.
It helps developers understand where and why an exception occurred.
Example
public class Test {

    public static void main(String[] args) {

        try {

            int x = 10 / 0;

        } catch (Exception e) {

            e.printStackTrace();
        }
    }
}
👉 printStackTrace() is commonly used to quickly analyze runtime exceptions in Java applications.
Sometimes one exception causes another exception internally.
Java supports exception chaining, where one exception is wrapped inside another exception to preserve the original cause.
This helps developers trace the real source of the problem more effectively.
Example
public class Test {

    static void process() throws Exception {

        try {

            int x = 10 / 0;

        } catch (ArithmeticException e) {

            throw new Exception("Calculation Failed", e);
        }
    }

    public static void main(String[] args) {

        try {

            process();

        } catch (Exception e) {

            e.printStackTrace();
        }
    }
}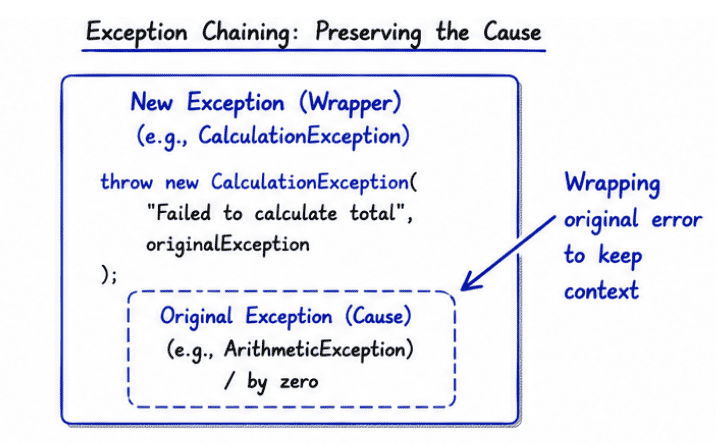
👉 Exception chaining makes stack traces more meaningful and helps developers analyze errors more effectively.
Developers use different debugging strategies to analyze exceptions and identify the root cause of problems efficiently.
Effective Debugging Techniques
Read the stack trace carefully
Identify the first application-level error
Check recent code changes
Use breakpoints in the IDE
Inspect variable and object values
Add proper logging statements
Reproduce the issue consistently
Analyze exception messages and root causes
👉 Systematic debugging and stack analysis help developers solve problems more effectively in real-world Java applications.
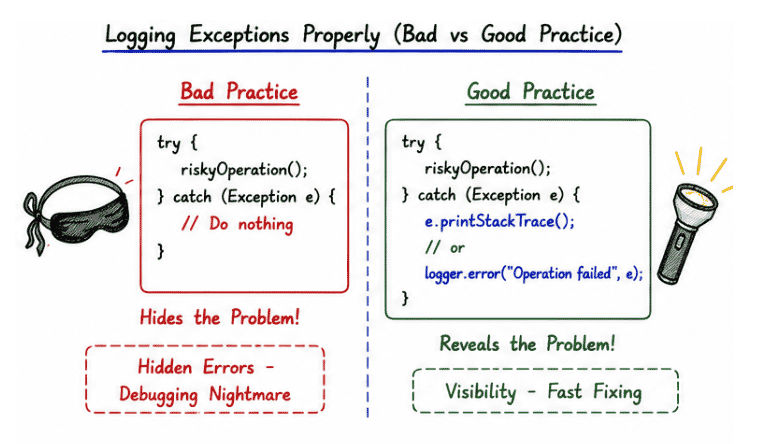
Exceptions should always be logged properly instead of being ignored silently.
Proper exception logging helps developers identify, analyze, and fix issues efficiently.
Bad Practice
catch (Exception e) {

}
👉 Empty catch blocks should never be used because they hide errors and make debugging difficult.
Good Practice
catch (Exception e) {

    e.printStackTrace();
}
👉 printStackTrace() displays detailed exception information during development and debugging.
Using Logging Frameworks
logger.error("Database Error", e);👉 Logging frameworks like Log4j or SLF4J provide professional exception logging for production systems.
In real-world Java applications, exception tracing and stack analysis are extremely important for identifying and fixing production issues.
Developers and support teams use different troubleshooting techniques to analyze failures efficiently.
Common Production Troubleshooting Techniques
Analyze application logs carefully
Monitor server and system logs
Track failed API requests and responses
Identify recurring exceptions and patterns
Use centralized logging and monitoring tools
Check root cause exceptions in stack traces
Correlate logs using timestamps and request IDs
Review recent deployments or configuration changes
Modern Java IDEs provide advanced debugging tools that help developers analyze stack traces and exceptions more efficiently.
Popular IDEs include:
IntelliJ IDEA
Eclipse IDE
Apache NetBeans
Common Stack Analysis Tools in IDEs
Call Stack Window → Shows method execution sequence
Exception Breakpoints → Stops execution when exceptions occur
Variable Inspection → Displays runtime variable values
Stack Frame Navigation → Helps move through method calls
Watches & Expression Evaluation → Evaluates expressions during debugging
Exception tracing and stack analysis are widely used in modern Java development for identifying, analyzing, and fixing runtime issues.
They are especially important in large-scale and enterprise applications.
Backend API debugging
Banking and financial applications
Spring Boot applications
Database error analysis
Production issue troubleshooting
Enterprise system monitoring
Cloud-based application debugging
Microservices and distributed systems
Faster bug detection
Easier debugging and troubleshooting
Better understanding of program execution flow
Helps locate the exact error location
Improves application reliability and stability
Simplifies maintenance of large applications
Helps identify root causes effectively
Large stack traces can be difficult to read
Deep recursive calls may create complex traces
Poor logging practices can hide useful details
Nested exceptions may become confusing
Production logs can contain excessive information
Requires debugging experience for proper analysis
Exception tracing and stack analysis are essential debugging techniques in Java development that help developers identify, understand, and fix runtime issues effectively.
Helps identify runtime errors quickly
Provides the exact error location
Improves debugging and troubleshooting efficiency
Helps analyze root causes of exceptions
Useful for maintaining large and enterprise applications
Essential for production support and monitoring
