
Durgesh Tiwari
Author
Building an AI agent that works is not enough. Once it runs in production, developers need visibility into what the agent is doing, where failures occur, how long each step takes, how many tokens it uses, and how much each task costs.
AI observability and performance monitoring helps developers understand the behavior, reliability, and performance of AI applications and agents in production.
A single user request may involve several operations:
User Request
     ↓
LLM Call
     ↓
Tool Selection
     ↓
API Call
     ↓
Retrieval
     ↓
Another LLM Call
     ↓
Final Response
If a response takes 15 seconds or produces an incorrect result, knowing only that the request was slow or failed is not enough. Developers need to identify which step caused the problem and why.
This requires visibility into the complete execution path using logging, tracing, metrics, and monitoring.
AI observability is the ability to understand what is happening inside an AI application by collecting and analyzing information about its execution.
Traditional software observability commonly relies on three signals:
Logs
Metrics
Traces
AI systems need these signals too, along with visibility into model calls, tool calls, retrieval, token usage, agent state, workflow execution, and cost.
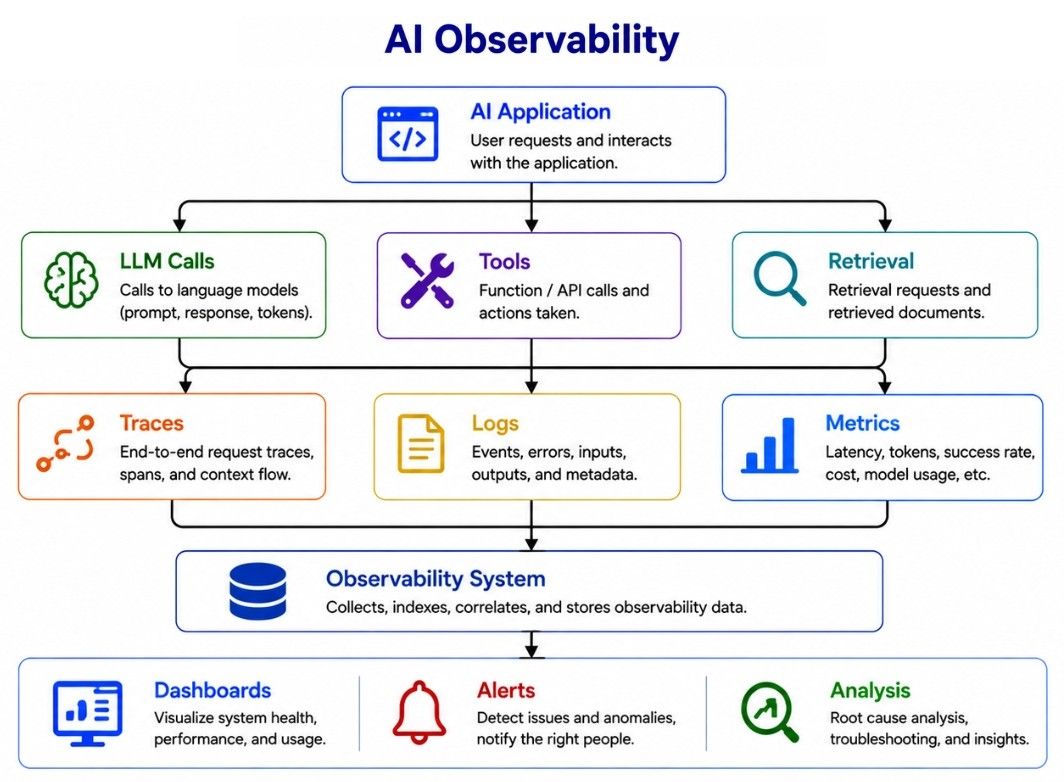
A simplified AI observability architecture looks like this:
               AI Application
                     ↓
          ┌──────────┼──────────┐
          ↓          ↓          ↓
       LLM Calls    Tools    Retrieval
          ↓          ↓          ↓
        Traces      Logs      Metrics
          └──────────┼──────────┘
                     ↓
             Observability System
                     ↓
        Dashboards / Alerts / Analysis
AI observability helps answer questions such as:
Why did this request fail?
Which tool did the agent call?
Which step was slow?
How many model calls occurred?
How many tokens were consumed?
Why did the cost increase?
Which agent step produced the error?
Did retrieval behave as expected?
Observability does not automatically determine whether an agent's result is correct. That is the role of evaluation.
Observability tells you what happened. Evaluation helps determine whether the behavior was good.
Logging records important events that occur while an AI system is running.
A traditional application might log events such as:
Request received
Database query started
Database query completed
Response returned
An AI agent may also log events such as:
Agent started
Model selected
Tool requested
Tool executed
Retry attempted
Human approval requested
Fallback activated
Workflow completed
For example:
10:03:12 Request received
10:03:13 Agent started
10:03:14 Tool selected: get_order
10:03:15 Tool completed
10:03:16 Model response generated
10:03:16 Request completed
Logs are useful for investigating specific events, errors, and workflow activity.
However, production systems should not log everything blindly. AI applications may process sensitive information such as customer data, documents, prompts, API responses, and credentials.
Logging should therefore include appropriate privacy and security controls. Avoid logging passwords, API keys, authentication tokens, or unnecessary personal information.
The goal is to capture enough information for debugging without creating additional privacy or security risks.
Logs show individual events, while tracing connects those events across a complete request.
For example, when a user asks:
Where is my order?
The system might execute:
Request
  ↓
LLM
  ↓
get_order
  ↓
Database
  ↓
LLM
  ↓
Response
A trace connects these operations so developers can inspect the complete execution path.
A trace is typically divided into smaller operations called spans:
Trace: request_4832

├── Span: Agent
├── Span: LLM Call
├── Span: Tool Call
│   └── get_order
├── Span: Database Query
└── Span: LLM Response
Each span can capture information such as start time, end time, duration, status, model, tool name, token usage, and errors.
Tracing is especially useful for finding performance bottlenecks. Suppose a request takes 12 seconds:
Agent planning       1 sec
LLM call             2 sec
Order API            8 sec
Final generation     1 sec
The trace shows that the Order API accounts for most of the latency, not the LLM.
Without tracing, developers may optimize the wrong component instead of fixing the actual bottleneck.
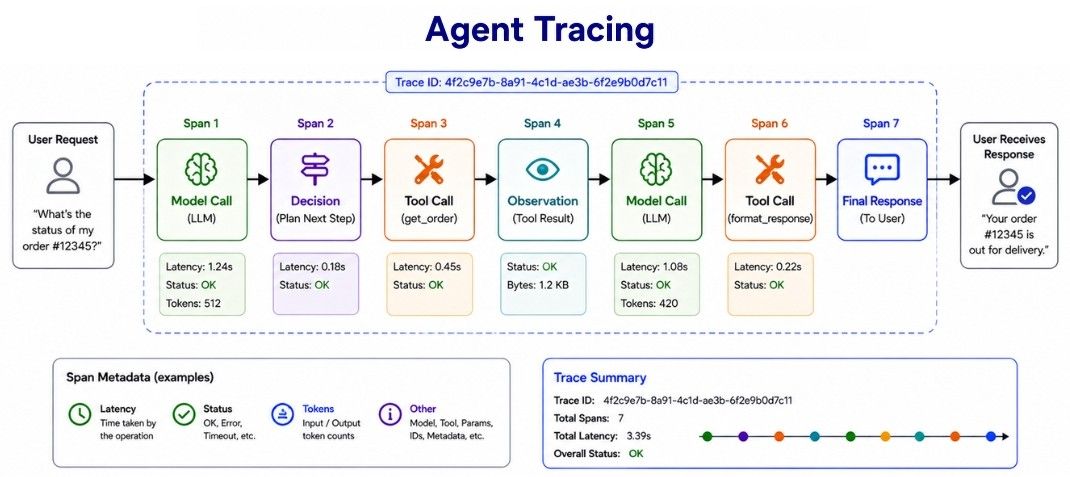
Agent tracing extends traditional tracing to capture the execution path of a multi-step AI agent.
An agent may repeatedly make decisions, call tools, observe results, and continue until the task is complete:
User Request
     ↓
Agent
     ↓
Search Documents
     ↓
Observation
     ↓
Agent
     ↓
Check Database
     ↓
Observation
     ↓
Agent
     ↓
Final Response
Instead of reconstructing this workflow from separate logs, an agent trace shows the complete sequence in one place.
For example:
Agent Run #912

Step 1
Model Call
Decision: Retrieve customer data

Step 2
Tool: get_customer
Status: Success
Latency: 320 ms

Step 3
Model Call
Decision: Retrieve order

Step 4
Tool: get_order
Status: Success
Latency: 640 ms

Step 5
Model Call
Final Response
Agent tracing is useful for identifying:
incorrect tool selection;
unnecessary tool calls;
retry loops;
incorrect routing;
slow workflow steps;
unexpected state transitions.
In multi-agent systems, traces can also show which agent handled each part of the task:
Supervisor
    ↓
Research Agent
    ↓
Database Agent
    ↓
Reviewer Agent
    ↓
Final Response
This provides visibility into the complete agent workflow, not just the final response.
Monitoring continuously tracks the health and performance of an AI application across many requests.
While logging and tracing help investigate individual requests, monitoring helps identify patterns, trends, and production-wide problems.
For example, a monitoring dashboard might show:
Today

Requests:           48,000
Success Rate:       96.8%
Average Latency:    2.4 sec
Tool Failure Rate:  1.7%
Average Cost:       $0.012/request
Escalation Rate:    3.1%
Monitoring can also trigger alerts when important metrics cross defined thresholds:
Normal Tool Failure Rate
1–2%

Current Tool Failure Rate
14%

        ↓
Alert Engineering Team
This helps teams detect production problems early, before they affect a large number of users.
LLM usage is often priced based on input and output tokens, so token consumption directly affects cost and can also influence latency.
A single request might use:
System instructions:     1,500 tokens
Conversation history:    4,000 tokens
Retrieved documents:     6,000 tokens
User request:              100 tokens
Output:                     800 tokens

Total:                   12,400 tokens
At production scale, even small inefficiencies can become expensive. Token monitoring helps identify where tokens are being consumed.
Component | Tokens |
|---|---|
Instructions | 1,500 |
Conversation | 4,000 |
Retrieved context | 6,000 |
Output | 800 |
Total | 12,300 |
If retrieved context consumes most of the tokens, improving retrieval and context selection may be more effective than simply switching models.
Token monitoring is especially important for agents because one user task can trigger multiple model calls:
User Request
    ↓
Planning Call
    ↓
Tool Call
    ↓
Analysis Call
    ↓
Tool Call
    ↓
Final Call
As a result, a single agent task may consume significantly more tokens than a simple chatbot response.
Latency is the time a user waits for the system to respond or complete a task.
For an AI agent, total latency can come from several components:
Total Latency
=
Model Latency
+
Tool Latency
+
Retrieval Latency
+
Network Latency
+
Workflow Overhead
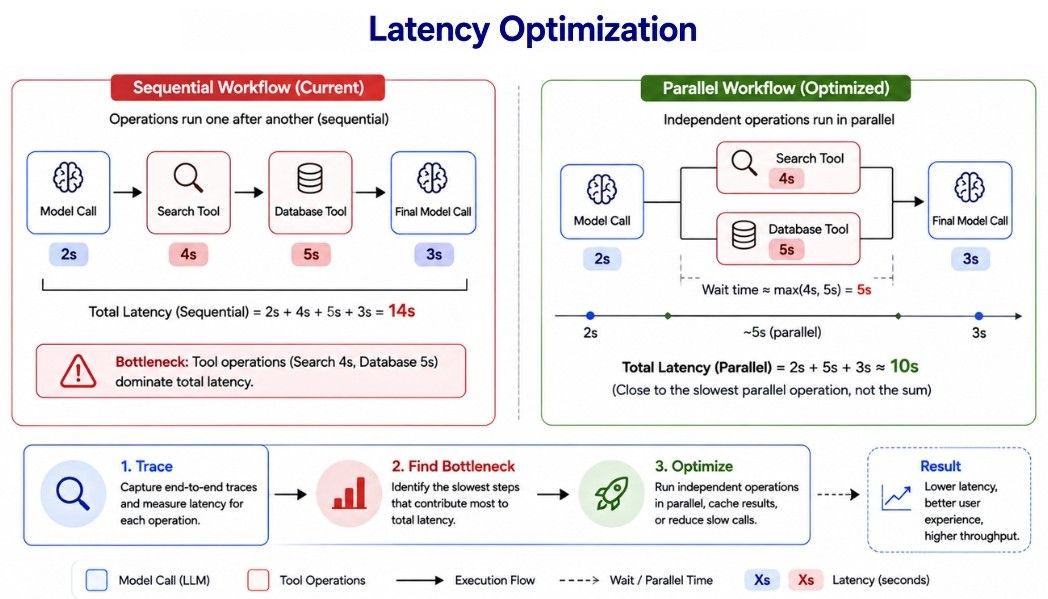
Suppose an agent takes 14 seconds:
Initial model call:    2 sec
Search tool:           4 sec
Database tool:         5 sec
Final model call:      3 sec
Switching to a faster model may not solve the problem because most of the time is spent in tools. Trace the workflow first, identify the bottleneck, and then optimize it.
Common latency optimization techniques include:
running independent operations in parallel;
reducing unnecessary model and tool calls;
retrieving only relevant context;
using smaller models for simple tasks;
caching safe, reusable results;
limiting unnecessary retries;
streaming responses when appropriate;
optimizing slow tools and APIs.
For example, three sequential searches might take:
Search A → 3 sec
Search B → 4 sec
Search C → 3 sec

Total ≈ 10 sec
If the searches are independent, they can run in parallel:
           ┌→ Search A ─┐
Request ───┼→ Search B ─┼→ Continue
           └→ Search C ─┘

Total ≈ slowest search
Parallel execution can significantly reduce latency, but only when the operations do not depend on each other's results.
Production AI agents can become expensive because one task may involve multiple LLM calls, retrieval operations, APIs, databases, and infrastructure resources.
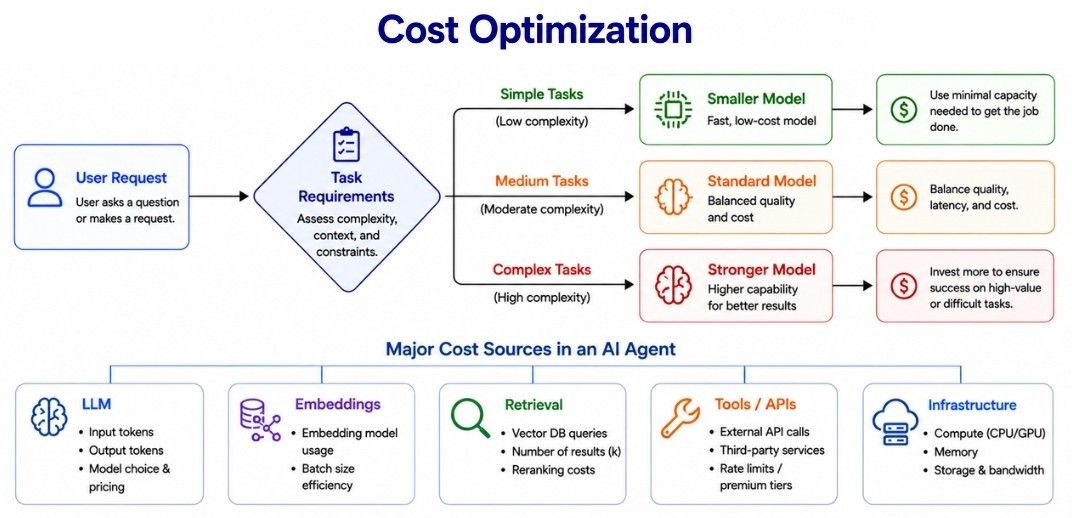
A simplified cost model is:
Total Agent Cost
=
LLM Cost
+
Embedding Cost
+
Retrieval Cost
+
Tool/API Cost
+
Infrastructure Cost
The goal is not to make every request as cheap as possible. It is to achieve the required quality and reliability at a reasonable cost.
For example, using the most capable model for every task may be unnecessary. A model-routing strategy can choose models based on task requirements:
Request
   ↓
Task Requirements
   ├── Simple  → Smaller Model
   ├── Medium  → Standard Model
   └── Complex → Stronger Model
Other cost optimization techniques include:
reducing unnecessary context;
avoiding duplicate model and tool calls;
caching appropriate results;
limiting agent loops and excessive retries;
using smaller models for simple subtasks;
optimizing retrieval and external service usage.
For agents, cost per completed task is often more meaningful than cost per model call.
A cheaper model that requires several attempts may ultimately cost more than a stronger model that completes the task successfully on the first attempt.
Failures in AI systems are not limited to server errors. An agent may complete a request technically while still failing to achieve the user's goal.
Production monitoring should therefore recognize different types of failures:
Infrastructure Failure
→ API timeout or server error

Tool Failure
→ Tool returned an error

Model Failure
→ Invalid or unusable model output

Workflow Failure
→ Incorrect routing or state transition

Agent Failure
→ Incorrect tool selection or action

Retrieval Failure
→ Relevant information was not retrieved

Policy Failure
→ Restricted action was attempted

Task Failure
→ User's goal was not completed
Some failures are easy to detect automatically:
HTTP 500
Timeout
Invalid JSON
Missing required field
Other failures require evaluation. For example:
Agent returned an answer
but used the wrong customer record.
From an infrastructure perspective, the request succeeded. From the user's perspective, it failed.
This is why production systems benefit from combining observability, monitoring, and evaluation to detect both technical failures and task-level failures.

There is no single metric that represents the health of every AI system. A useful production dashboard should combine system, agent, quality, and business metrics.
Area | Example Metrics |
|---|---|
Reliability | Success rate, error rate, timeout rate |
Performance | Average latency, p95 latency, p99 latency |
LLM Usage | Input tokens, output tokens, model calls |
Cost | Cost per request, cost per successful task |
Tools | Tool-call count, failure rate, latency |
Agents | Steps per task, retries, loop count |
RAG | Retrieval latency, retrieval quality |
Workflow | Completion rate, escalation rate |
Quality | Task success, evaluation scores |
Safety | Guardrail triggers, blocked actions |
Percentile latency is especially useful because averages can hide slow requests.
For example:
Average latency:  2.1 sec
p95 latency:      8.4 sec
p99 latency:     19.2 sec
The average looks reasonable, but p95 means 95% of requests complete within 8.4 seconds, while the slowest 5% take longer. Similarly, p99 shows the latency experienced near the slowest 1% of requests.
Metrics should also be segmented when useful:
Model
Tool
Workflow
Agent Version
Request Type
Customer Tier
Deployment Version
This helps teams isolate whether a performance or reliability problem is associated with a particular model, tool, workflow, agent version, or type of request.
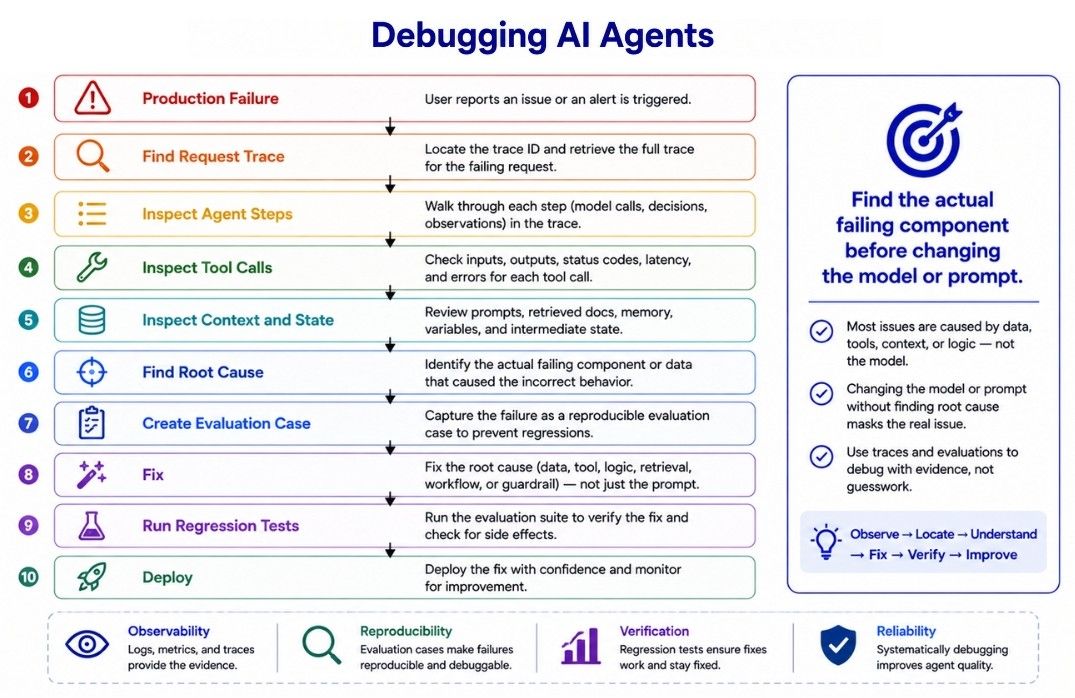
Debugging an AI agent can be more complex than debugging traditional software because failures may originate from the model, instructions, context, memory, retrieval, tools, external APIs, workflow, or application state.
Suppose an agent returns the wrong shipping status. Instead of immediately changing the prompt, inspect the execution trace:
Wrong Answer
    ↓
Was the correct order identified?
    ↓
Was the correct tool called?
    ↓
Did the tool return correct data?
    ↓
Was the data added to context?
    ↓
Did the model interpret it correctly?
    ↓
Was the final response grounded?
For example:
User:
Where is order 8392?

Agent:
Calls get_order(8932)

Tool:
Returns valid information for order 8932

Agent:
Answers using that information
Here, the tool works correctly. The failure occurred because the agent supplied the wrong tool argument.
Compare that with:
Agent:
Calls get_order(8392)

Tool:
Returns information for order 8932
Now the problem is likely in the tool or backend, not the agent's tool selection.
Good observability helps developers identify where the failure actually occurred, so they can fix the correct component.
A practical debugging process is:
Production Failure
       ↓
Find Request Trace
       ↓
Inspect Agent Steps
       ↓
Inspect Tool Calls
       ↓
Inspect Context and State
       ↓
Find Root Cause
       ↓
Create Evaluation Case
       ↓
Fix
       ↓
Run Regression Tests
       ↓
Deploy
When a production failure reveals a new failure pattern, add it to the evaluation dataset whenever possible. This turns real-world failures into regression tests and helps prevent the same problem from returning.
AI observability and performance monitoring helps developers understand what happens inside production AI applications and agents.
Logging, tracing, agent tracing, and monitoring provide visibility into execution paths, while metrics such as latency, token usage, cost, failures, and task performance help identify production problems.
Good observability makes it easier to find the root cause of slow, expensive, unreliable, or incorrect agent behavior and improve the system continuously.
