

Why Is My Java Application Slow? 10 Common Causes and How to Fix Them
Introduction
Java is one of the most popular programming languages in the world. It powers banking applications, e-commerce platforms, enterprise systems, and large-scale backend services. Companies like Amazon, Netflix, and LinkedIn use Java extensively because of its reliability, scalability, and strong ecosystem.
However, many developers eventually face the same question:
"Why is my Java application slow?"
The truth is that Java itself is not inherently slow. Modern JVMs are highly optimized and capable of delivering excellent performance. In most cases, performance problems occur because of inefficient code, poor database interactions, memory issues, or incorrect configurations.
In this guide, we will explore the 10 most common reasons why Java applications become slow and discuss practical ways to fix them.
1. Inefficient Database Queries
One of the biggest reasons behind slow Java applications is poor database interaction.
Even if your Java code is optimized, inefficient SQL queries can significantly increase response times.
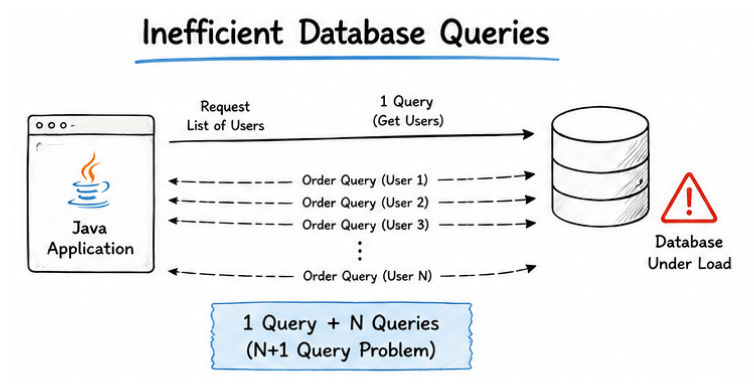
Example: N+1 Query Problem
for (User user : users) {
    List<Order> orders = orderRepository.findByUserId(user.getId());
}
If there are 100 users, this code can generate 101 database queries, creating unnecessary overhead.
How to Fix It
Use
JOIN FETCHwhere appropriate.Apply batch fetching strategies.
Optimize slow SQL queries.
Monitor query execution plans.
2. Memory Leaks
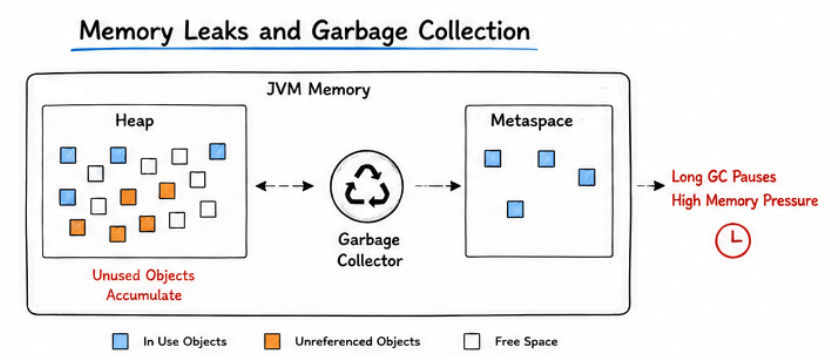
Java provides automatic memory management, but memory leaks can still happen.
A memory leak occurs when objects remain referenced even though they are no longer needed.
Common Causes
Static collections growing indefinitely
Unclosed resources
Event listeners not removed properly
Caches without expiration policies
How to Fix It
Use proper cache eviction policies.
Analyze heap dumps regularly.
Remove unnecessary object references.
Monitor heap usage using profiling tools.
3. Excessive Object Creation
Creating too many temporary objects increases garbage collection activity.
Example
for (int i = 0; i < 100000; i++) {
    String message = new String("Hello");
}
This repeatedly creates unnecessary objects.
Better Approach
String message = "Hello";

for (int i = 0; i < 100000; i++) {
    System.out.println(message);
}
How to Fix It
Reuse objects whenever possible.
Avoid unnecessary wrapper objects.
Profile allocation hotspots.
Reduce excessive object creation in loops.
4. Garbage Collection Pauses
Garbage Collection (GC) helps reclaim unused memory, but frequent or long GC pauses can affect performance.
Signs of GC Problems
Sudden response time spikes
Increased CPU usage
Temporary application freezes
How to Fix It
Monitor GC logs regularly.
Tune JVM heap settings.
Choose an appropriate garbage collector.
Reduce unnecessary object allocations.
5. Blocking Operations
Blocking operations force threads to wait, reducing application throughput.
Common Examples
Slow database calls
File I/O operations
External API requests
Long-running synchronous tasks
Example
Thread.sleep(5000);This blocks the thread for five seconds.
How to Fix It
Use asynchronous processing when suitable.
Configure thread pools correctly.
Implement proper timeouts.
Optimize external dependencies.
6. Improper JVM Configuration
The JVM has a major impact on application performance.
Incorrect configuration can result in unnecessary garbage collection and inefficient memory usage.
Common Problems
Heap size too small
Heap size too large
Incorrect garbage collector selection
Poor Metaspace configuration
Example
java -Xms512m -Xmx512m -jar app.jarHow to Fix It
Monitor JVM performance metrics.
Configure appropriate heap sizes.
Analyze GC logs.
Test JVM settings before production deployment.
7. Too Many Threads
Multithreading improves performance when used correctly. However, excessive thread creation can hurt application performance.
Problem Example
for (int i = 0; i < 10000; i++) {
    new Thread(() -> processTask()).start();
}
Creating thousands of threads can overwhelm system resources.
Better Approach
ExecutorService executor = Executors.newFixedThreadPool(10);

executor.submit(() -> processTask());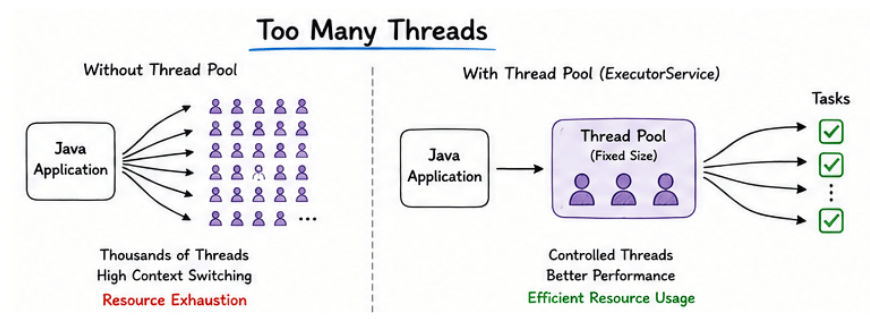
How to Fix It
Use
ExecutorService.Configure thread pools appropriately.
Avoid unlimited thread creation.
Monitor thread usage regularly.
8. Inefficient Algorithms and Data Structures
The choice of algorithms and data structures directly affects application performance.
Example
Using a list for frequent lookups:
List<String> users = new ArrayList<>();

if (users.contains("Durgesh")) {
    // process
}
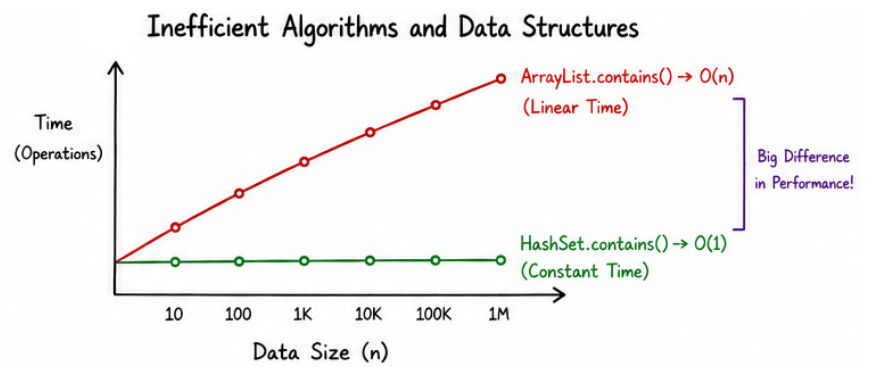
For large datasets, this becomes inefficient.
Better Approach
Set<String> users = new HashSet<>();

if (users.contains("Durgesh")) {
    // process
}
Why It Matters
ArrayList.contains()→ O(n)HashSet.contains()→ O(1)
How to Fix It
Understand algorithm complexity.
Choose appropriate data structures.
Review performance-critical sections of code.
9. Slow External Services
Many Java applications depend on third-party systems.
Examples include:
Payment gateways
External APIs
Authentication providers
Other microservices
If these systems respond slowly, your application performance suffers.
How to Fix It
Configure connection and read timeouts.
Use circuit breaker patterns.
Implement retry mechanisms carefully.
Cache responses when appropriate.
10. Lack of Caching
Fetching the same data repeatedly from the database increases response times.
Caching can significantly improve performance.
Without Cache
public Product getProduct(Long id) {
    return repository.findById(id).orElse(null);
}
With Cache
@Cacheable("products")
public Product getProduct(Long id) {
    return repository.findById(id).orElse(null);
}
Benefits of Caching
Faster responses
Reduced database load
Improved scalability

How to Fix It
Use Spring Cache.
Implement Redis for distributed caching.
Cache frequently accessed data.
Java Performance Checklist
Before deploying your Java application, ask yourself:
Are database queries optimized?
Is caching implemented where needed?
Are thread pools configured correctly?
Have you analyzed garbage collection behavior?
Are external API calls protected with timeouts?
Is the JVM properly configured?
Have you performed load testing?
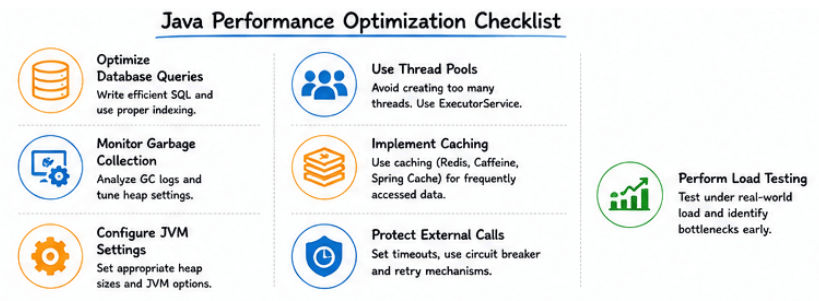
Following this checklist can help prevent many common performance problems.
Frequently Asked Questions (FAQs)
Is Java a slow programming language?
No. Modern Java is highly optimized and powers many high-performance enterprise systems.
Why does my Java application become slower over time?
Common causes include memory leaks, increasing database load, excessive object creation, and inefficient resource management.
Does Garbage Collection make Java slow?
Garbage Collection itself is not a problem. However, poor memory management can lead to long GC pauses.
How can I improve Java application performance?
Optimize database queries, implement caching, tune the JVM, and profile the application to identify bottlenecks.
Which tools can be used for Java performance analysis?
Popular tools include VisualVM, Java Flight Recorder, JProfiler, and YourKit.
Should I optimize my Java application early?
Avoid premature optimization. First identify actual bottlenecks and then optimize the areas that matter most.
Conclusion
Java is not inherently slow. Most performance problems happen because of issues like inefficient database queries, memory leaks, improper JVM settings, excessive thread creation, or poor coding practices.
The good news is that these problems can be identified and fixed. By monitoring your application, optimizing critical areas, and following performance best practices, you can build fast, scalable, and reliable Java applications.
Remember, don't assume Java is the problem—find the bottleneck first, then optimize what truly matters.